Inhibition of MDR1 gene expression by chimeric HNA antisense oligonucleotides
- PMID: 15316104
- PMCID: PMC514393
- DOI: 10.1093/nar/gkh775
Inhibition of MDR1 gene expression by chimeric HNA antisense oligonucleotides
Abstract
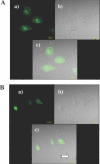
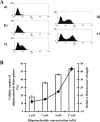
Hexitol nucleic acids (HNAs) are nuclease resistant and provide strong hybridization to RNA. However, there is relatively little information on the biological properties of HNA antisense oligonucleotides. In this study, we compared the antisense effects of a chimeric HNA 'gapmer' oligonucleotide comprising a phosphorothioate central sequence flanked by 5' and 3' HNA sequences to conventional phosphorothioate oligonucleotides and to a 2'-O-methoxyethyl (2'-O-ME) phosphorothioate 'gapmer'. The antisense oligomers each _targeted a sequence bracketing the start codon of the message of MDR1, a gene involved in multi-drug resistance in cancer cells. Antisense and control oligonucleotides were delivered to MDR1-expressing cells using transfection with the cationic lipid Lipofectamine 2000. The anti-MDR1 HNA gapmer was substantially more potent than a phosphorothioate oligonucleotide of the same sequence in reducing expression of P-glycoprotein, the MDR1 gene product. HNA and 2'-O-ME gapmers displayed similar potency, but a pure HNA antisense oligonucleotide (lacking the phosphorothioate 'gap') was ineffective, indicating that RNase H activity was likely required. Treatment with anti-MDR1 HNA gapmer resulted in increased cellular accumulation of the drug surrogate Rhodamine 123 that correlated well with the reduced cell surface expression of P-glycoprotein. Thus, HNA gapmers may provide a valuable additional tool for antisense-based investigations and therapeutic approaches.
Figures


Similar articles
-
Inhibition of expression of the multidrug resistance-associated P-glycoprotein of by phosphorothioate and 5' cholesterol-conjugated phosphorothioate antisense oligonucleotides.Mol Pharmacol. 1996 Oct;50(4):808-19. Mol Pharmacol. 1996. PMID: 8863825
-
Modulation of multidrug resistance with antisense oligodeoxynucleotide to mdr1 mRNA.Ann Surg Oncol. 1996 Jan;3(1):80-5. doi: 10.1007/BF02409056. Ann Surg Oncol. 1996. PMID: 8770307
-
Evaluating the specificity of antisense oligonucleotide conjugates. A DNA array analysis.J Biol Chem. 2002 Jun 21;277(25):22980-4. doi: 10.1074/jbc.M203347200. Epub 2002 Apr 10. J Biol Chem. 2002. PMID: 11948195
-
Importance of nucleotide sequence and chemical modifications of antisense oligonucleotides.Biochim Biophys Acta. 1999 Dec 10;1489(1):53-68. doi: 10.1016/s0167-4781(99)00141-4. Biochim Biophys Acta. 1999. PMID: 10806997 Review.
-
Pharmacokinetics of oligonucleotides.Ciba Found Symp. 1997;209:60-75; discussion 75-8. doi: 10.1002/9780470515396.ch6. Ciba Found Symp. 1997. PMID: 9383569 Review.
Cited by
-
Evaluation of mAb 2C5-modified dendrimer-based micelles for the co-delivery of siRNA and chemotherapeutic drug in xenograft mice model.Drug Deliv Transl Res. 2024 Aug;14(8):2171-2185. doi: 10.1007/s13346-024-01562-5. Epub 2024 Mar 20. Drug Deliv Transl Res. 2024. PMID: 38507033 Free PMC article.
-
Evaluation of mAb 2C5-modified dendrimer-based micelles for the co-delivery of siRNA and chemotherapeutic drug in xenograft mice model.Res Sq [Preprint]. 2023 Dec 11:rs.3.rs-3713164. doi: 10.21203/rs.3.rs-3713164/v1. Res Sq. 2023. Update in: Drug Deliv Transl Res. 2024 Aug;14(8):2171-2185. doi: 10.1007/s13346-024-01562-5 PMID: 38168301 Free PMC article. Updated. Preprint.
-
The Medicinal Chemistry of Artificial Nucleic Acids and Therapeutic Oligonucleotides.Pharmaceuticals (Basel). 2022 Jul 22;15(8):909. doi: 10.3390/ph15080909. Pharmaceuticals (Basel). 2022. PMID: 35893733 Free PMC article. Review.
-
Co-Delivery of siRNA and Chemotherapeutic Drug Using 2C5 Antibody-_targeted Dendrimer-Based Mixed Micelles for Multidrug Resistant Cancers.Pharmaceutics. 2022 Jul 15;14(7):1470. doi: 10.3390/pharmaceutics14071470. Pharmaceutics. 2022. PMID: 35890364 Free PMC article.
-
Pharmacokinetics and Proceedings in Clinical Application of Nucleic Acid Therapeutics.Mol Ther. 2021 Feb 3;29(2):521-539. doi: 10.1016/j.ymthe.2020.11.008. Epub 2020 Nov 12. Mol Ther. 2021. PMID: 33188937 Free PMC article. Review.
References
-
- Ambudkar S.V., Kimchi-Sarfaty,C., Sauna,Z.E. and Gottesman,M.M. (2003) P-glycoprotein: from genomics to mechanism. Oncogene, 22, 7468–7485. - PubMed
-
- Juliano R.L. and Ling,V. (1976) A surface glycoprotein modulating drug permeability in Chinese hamster ovary cell mutants. Biochim. Biophys. Acta, 455, 152–162. - PubMed
-
- Licht T., Pastan,I., Gottesman,M. and Herrmann,F. (1994) P-glycoprotein-mediated multidrug resistance in normal and neoplastic hematopoietic cells. Ann. Hematol., 69, 159–171. - PubMed
-
- Bradley G. and Ling,V. (1994) P-glycoprotein, multidrug-resistance and tumor progression. Cancer Metastasis Rev., 13, 223–233. - PubMed
-
- Ambudkar S.V., Dey,S., Hrycyna,C.A., Ramachandra,M., Pastan,I. and Gottesman,M.M. (1999) Biochemical, cellular, and pharmacological aspects of the multidrug transporter. Annu. Rev. Pharmacol. Toxicol., 39, 361–398. - PubMed
Publication types
MeSH terms
Substances
Grants and funding
LinkOut - more resources
Full Text Sources
Other Literature Sources
Miscellaneous

