Comparative Study
. 2005 Oct 5;24(19):3482-92.
doi: 10.1038/sj.emboj.7600819. Epub 2005 Sep 15.

Novel role of p53 in maintaining mitochondrial genetic stability through interaction with DNA Pol gamma

Affiliations
Comparative Study

Novel role of p53 in maintaining mitochondrial genetic stability through interaction with DNA Pol gamma

Geetha Achanta et al. EMBO J. .

Abstract

Mitochondrial DNA (mtDNA) mutations and deletions are frequently observed in cancer, and contribute to altered energy metabolism, increased reactive oxygen species (ROS), and attenuated apoptotic response to anticancer agents. The mechanisms by which cells maintain mitochondrial genomic integrity and the reason why cancer cells exhibit more frequent mtDNA mutations remain unclear. Here, we report that the tumor suppressor molecule p53 has a novel role in maintaining mitochondrial genetic stability through its ability to translocate to mitochondria and interact with mtDNA polymerase gamma (pol gamma) in response to mtDNA damage induced by exogenous and endogenous insults including ROS. The p53 protein physically interacts with mtDNA and pol gamma, and enhances the DNA replication function of pol gamma. Loss of p53 results in a significant increase in mtDNA vulnerability to damage, leading to increased frequency of in vivo mtDNA mutations, which are reversed by stable transfection of wild-type p53. This study provides a mechanistic explanation for the accelerating genetic instability and increased ROS stress in cancer cells associated with loss of p53.


Figures

Figure 1
Figure 1
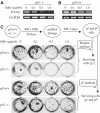
Comparison of ethidium-induced mtDNA depletion and loss of mitochondrial respiratory activity of p53 isogenic cells. (A, B) HCT116 p53+/+ cells and the isogenic p53−/− cells were exposed to EtBr (100 ng/ml) for 120 days and several subclones of surviving cells were isolated and expanded as described in Materials and methods. The D-loop region of mtDNA from four individual clones (C1–C4), each derived from either parental (Par) p53+/+ or p53−/− cells was analyzed by PCR as described previously (Carew et al, 2003). (C, D) Mitochondrial respiratory activity in parental cells and isolated clones was measured by an oxygen consumption assay (Pelicano et al, 2003). The slope of the oxygen consumption curve reflects the respiratory activity.
Figure 2
Figure 2
Absence of p53 leads to vulnerability of mtDNA to damage by EtBr. (A, B) HCT116 p53+/+ and p53−/− cells were exposed to the indicated concentrations of EtBr for 20 days, DNA was isolated from the cells and the D-loop region of mtDNA was analyzed by PCR. (C) HCT116 p53+/+ and p53−/− cells were exposed to the indicated concentrations of EtBr in McCoy's supplemented culture medium (see Materials and methods) for 20 days, with regular culture split every 3–4 days. After 20 days, the cells were cultured in SM medium (McCoy's+supplements) without EtBr for 6 days. The cells were then plated (3000/well) in duplicate sets. One set was incubated in regular culture medium (McCoy's+10% FBS) to grow cells with competent mitochondrial respiratory function (ρ+ cells). Another set of cells was cultured in medium supplemented with glucose, pyruvate, and uridine to allow the growth of respiration-competent cells as well as respiration-deficient (ρ0) cells. The colonies growing in the supplemented medium were a mixture of ρ+ and ρ0 cells.
Figure 3
Figure 3
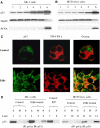
Ethidium induces mitochondrial translocation of p53 and its interaction with pol γ. (A) ML-1 cells (wt p53) and (B) HCT116 p53+/+ cells were incubated with EtBr as indicated below. Protein extracts from the mitochondrial fractions were assayed for p53 by Western blotting. The mitochondrial protein Hsp60 was used as a loading control. The nuclear protein PCNA was also blotted to show that nuclear protein contamination in the mitochondrial fractions was negligible. Lane 1, mitochondrial fraction from control cells; lanes 2–3, mitochondrial fractions from cells treated with 0.3 μg/ml ethidium for 12 and 24 h, respectively; lanes 4–5, mitochondrial fractions from cells treated with 1 μg/ml ethidium for 12 and 24 h, respectively; lane 6, total protein extracts from control cells. (C) Confocal microscopic analysis of intracellular localization of p53 and pol γ. HCT116 p53+/+ cells was incubated with or without EtBr (1 μg/ml, 24 h), fixed, and labeled for p53 (green) and pol γ (red) as described in Materials and methods. The majority of p53 outside the nuclear region was colocalized with pol γ in the ethidium-treated cells, as evidenced by the yellow signal. (D) Coimmunoprecipitation of p53 with pol γ. Protein extracts (1 mg) from cells treated with or without ethidium (1 μg/ml, 12 h) were incubated with 1.5 μg of rabbit polyclonal anti-DNA pol γ antibody or control rabbit IgG at 4°C for 5 h, and the protein complexes were separated using magnetic beads coated with protein A as described under Materials and methods. The supernatant (S), last wash (W), and pellet (P) were assayed for p53 by Western blotting.
Figure 4
Figure 4
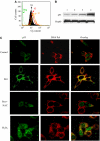
Increased mitochondrial generation of ROS and mtDNA damage causes p53 localization to mitochondria and interaction with pol γ. (A) HCT116 p53+/+ cells were incubated with various concentrations of rotenone, and increased O2 generation was measured by flow cytometry analysis as described previously (Huang et al, 2000). Green curve, background fluorescence without labeling with dihydroethidium; black curve, control cells labeled with dihydroethidium for 60 min; red curve, cells treated with 100 nM rotenone for 8 h and labeled with dihydroethidium for 60 min; orange curve, cells treated with 500 nM rotenone for 8 h and labeled with dihydroethidium for 60 min. The numbers indicate the mean O2 contents for the respective curves (displayed in log scale). (B) Protein extracts of mitochondria isolated from the control or rotenone-treated cells were assayed for p53 by Western blotting. Mitochondrial protein Hsp60 was also measured as a loading control. Lane 1, mitochondria from control cells; lanes 2–3, mitochondria from cells treated with 100 nM rotenone for 12 and 24 h, respectively; lane 4, mitochondria from cells treated with 300 nM rotenone for 24 h. (C) HCT116 p53+/+ cells were untreated or treated with 100 nM rotenone (Rot) alone for 24 h or in combination with 3 mM NAC, or with 50 μM H2O2 for 24 h as indicated. NAC was preincubated 1 h before addition of rotenone. The cells were fixed and immunostained for p53 (green) and pol γ (red), and visualized by confocal microscopic analysis as described in Materials and methods.
Figure 5
Figure 5
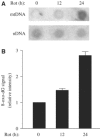
Preferential oxidative mtDNA damage induced by rotenone. (A) HCT116 cells were treated with 300 nM rotenone for 12–24 h as indicated. nDNA and mtDNA were isolated, dot-blotted onto a nitrocellulose membrane, and assayed for 8-oxo-dG residues in DNA using a specific antibody against 8-oxo-dG as described in Materials and methods. (B) Quantitation of oxidative mtDNA damage induced by rotenone. The intensity of the dots of the mtDNA samples was measured by densitometry. The bars show the relative dot intensity compared to the control sample. Data represent mean±s.d. from three separate experiments.
Figure 6
Figure 6
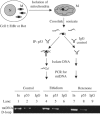
Physical interaction of p53 with mtDNA in whole cells. HCT116 cells (p53+/+) were incubated with or without EtBr (1 μg/ml) or rotenone (300 nM) for 24 h. Mitochondria were isolated and subjected to mtDIP-PCR assay using p53 antibody for immunoprecipitation (nonspecific IgG antibody as control) and mitochondrial D-loop-specific primers for PCR detection of mtDNA as described in Materials and methods. The PCR products were analyzed by agarose gel electrophoresis. Lanes 1–3, PCR products from mitochondria isolated from control cells without treatment with ethidium or rotenone; lanes 4–6, PCR products from mitochondria of cells treated with ethidium; lanes 7–9, PCR products from mitochondria of cells treated with rotenone. Note: In, input control (mtDNA before immunoprecipitation); p53, immunoprecipitation with p53 antibody; IgG, immunoprecipitation with control IgG antibody; N, nucleus; M, mitochondria.
Figure 7
Figure 7
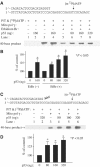
p53 enhances the DNA replication function of pol γ in vitro. (A) In vitro DNA primer extension by pol γ in the presence and absence of p53 and EtBr. Mitochondrial protein extracts containing pol γ were isolated from HCT116 p53−/− cells as described in Materials and methods. The primer/template DNA sequence is shown on top of the figure. Reaction mixtures containing the indicated components were incubated at 37°C for 20 min, and analyzed on a denaturing polyacrylamide gel. (B) The radioactivity of each 40-base product band from (A) was quantified using a phosphorimager, and expressed as % intensity of the respective control samples. Each bar represents mean±s.e. of three separate determinations. *Indicates statistically significant increase in band intensity. (C) Effect of p53 on in vitro DNA primer extension by pol γ using DNA primer/template containing mismatched nucleotides. The reaction conditions were similar to those described in (A), except that ethidium was excluded, and the last three nucleotides at the 3′-end of the primer were altered to create a 3-nucleotide mismatched region as indicated above (slanted letters). The reaction mixtures containing the indicated amount of p53 protein were incubated at 37oC for 20 min, and analyzed on a 15% denaturing polyacrylamide gel. (D) The radioactivity of the 40-base product band in (C) was quantified using a phosphorimager. The intensity of each band was expressed as % of the control band (without p53). Each bar represents means±s.e. from three separate gel analyses. *Indicates statistically significant increase in band intensity.
Figure 8
Figure 8
p53 suppresses ethidium- and ROS-induced mitochondrial mutations in vivo. HCT116 p53+/+ cells, p53−/− cells, or p53−/− cells transfected with wt p53 (rescue, see Materials and methods) were incubated with 0, 30, or 100 ng/ml of EtBr for 3 days, and then in fresh McCoy's medium without ethidium for an additional 3 days. The cells were plated in six-well plates at the indicated cell density and incubated with 1 mM CAP for 14 days to select surviving colonies with mtDNA mutations in the 16S rRNA gene as described previously (Kearsey and Craig, 1981). After a 14-day incubation period with a replacement of culture medium containing 1 mM CAP on day 7, the surviving colonies were fixed, stained with 5% Giemsa staining solution and photographed. For induction of mitochondrial mutations by rotenone (Rot), cells were first incubated with 100 nM rotenone for 8 h, washed, and then cultured in fresh medium without rotenone for 40 h. This chemical exposure was repeated for three cycles. CAP-resistant mutants were selected as described above.
Figure 9
Figure 9
Schematic illustration of the novel role of p53 in maintaining genetic stability. (1) mtDNA is vulnerable to exogenous and endogenous DNA-damaging agents such as chemicals and ROS. (2) Mutations of mtDNA lead to mitochondrial respiratory malfunction and increased free radical generation. (3) The increase in ROS serves as a constant source of mutagens that cause further damage to mtDNA, leading to further amplification of ROS stress. (4) ROS also damages nDNA and promotes genetic instability and cancer progression. The ability of p53 to interact with mitochondrial pol γ and enhance mtDNA integrity provides a mechanism to suppress the ROS amplification circuit. This novel function, together with the previously demonstrated activity in regulation of the cell cycle and apoptosis in response to DNA damage, represents the important role of p53 as a major tumor suppressor molecule.

Similar articles

Cited by

References

    1. Achanta G, Haung P (2004) Role of p53 in sensing oxidative DNA damage in response to reactive oxygen species-generating agents. Cancer Res 64: 6233–6239 - PubMed
    1. Anderson S, Bankier AT, Barrell BG, de Bruijn MH, Coulson AR, Drouin J, Eperon IC, Nierlich DP, Roe BA, Sanger F, Schreier PH, Smith AJ, Staden R, Young IG (1981) Sequence and organization of the human mitochondrial genome. Nature 290: 457–465 - PubMed
    1. Blanc H, Wright CT, Bibb MJ, Wallace DC, Clayton DA (1981) Mitochondrial DNA of chloramphenicol-resistant mouse cells contains a single nucleotide change in the region encoding the 3′ end of the large ribosomal RNA. Proc Natl Acad Sci USA 78: 3789–3793 - PMC - PubMed
    1. Bunz F, Dutriaux A, Lengauer C, Waldman T, Zhou S, Brown JP, Sedivy JM, Kinzler KW, Vogelstein B (1998) Requirement for p53 and p21 to sustain G2 arrest after DNA damage. Science 282: 1497–1501 - PubMed
    1. Carew JS, Huang P (2002) Mitochondrial defects in cancer. Mol Cancer 1: 9. - PMC - PubMed

Publication types

MeSH terms

  NODES
Note 1
Project 1
twitter 2