. 2006 Nov 15;20(22):3130-46.
doi: 10.1101/gad.1478706.

Smad4 is dispensable for normal pancreas development yet critical in progression and tumor biology of pancreas cancer

Affiliations

Smad4 is dispensable for normal pancreas development yet critical in progression and tumor biology of pancreas cancer

Nabeel Bardeesy et al. Genes Dev. .

Abstract

SMAD4 is inactivated in the majority of pancreatic ductal adenocarcinomas (PDAC) with concurrent mutational inactivation of the INK4A/ARF tumor suppressor locus and activation of the KRAS oncogene. Here, using genetically engineered mice, we determined the impact of SMAD4 deficiency on the development of the pancreas and on the initiation and/or progression of PDAC-alone or in combination with PDAC--relevant mutations. Selective SMAD4 deletion in the pancreatic epithelium had no discernable impact on pancreatic development or physiology. However, when combined with the activated KRAS(G12D) allele, SMAD4 deficiency enabled rapid progression of KRAS(G12D)-initiated neoplasms. While KRAS(G12D) alone elicited premalignant pancreatic intraepithelial neoplasia (PanIN) that progressed slowly to carcinoma, the combination of KRAS(G12D) and SMAD4 deficiency resulted in the rapid development of tumors resembling intraductal papillary mucinous neoplasia (IPMN), a precursor to PDAC in humans. SMAD4 deficiency also accelerated PDAC development of KRAS(G12D) INK4A/ARF heterozygous mice and altered the tumor phenotype; while tumors with intact SMAD4 frequently exhibited epithelial-to-mesenchymal transition (EMT), PDAC null for SMAD4 retained a differentiated histopathology with increased expression of epithelial markers. SMAD4 status in PDAC cell lines was associated with differential responses to transforming growth factor-beta (TGF-beta) in vitro with a subset of SMAD4 wild-type lines showing prominent TGF-beta-induced proliferation and migration. These results provide genetic confirmation that SMAD4 is a PDAC tumor suppressor, functioning to block the progression of KRAS(G12D)-initiated neoplasms, whereas in a subset of advanced tumors, intact SMAD4 facilitates EMT and TGF-beta-dependent growth.


Figures

Figure 1.
Figure 1.
Conditional deletion of Smad4 in the pancreas. (A, top) Genomic structure of the _targeted Smad4 allele. Exons (black rectangles), the Pgk-Neo cassette, loxP sites, Frt sites, and the probe for embryonic stem (ES) cell screening (black bar) are depicted. (Bottom) Southern blot of _targeted Smad4 locus in two ES cell clones (arrowheads). (B) Western blot analysis of Smad4 expression in pancreatic lysates from 8-wk-old Pdx1-Cre Smad4+/+ and Pdx1-Cre Smad4lox/lox mice. (C) Histological sections from 8-wk-old Pdx1-Cre Smad4+/+ (panels i–v) and Pdx1-Cre Smad4lox/lox (panels vix) mice stained with H&E (panels i,vi); with antibodies to insulin (panels ii,vii), glucagon (panels iii,viii), and amylase (panels iv,ix); and with DBA-lectin (panels v,x). Magnifications: Panels i,vi, 50×; panels ii,v,vii,x, 100×; panels iii,iv,viii,ix, and insets, panels v,x, 200×; insets, panels i,vi, 400×.
Figure 2.
Figure 2.
TGF-β family signaling in KrasG12D-initiated PanIN/PDAC. Immunohistochemical staining for TGF-β (A) and BMP-4 (B) in pancreata from wild-type mice (panel i), Pdx1-Cre LSL-KrasG12D mice (panel ii), and Pdx1-Cre LSL-KrasG12D Ink4a/Arflox/lox mice(panel iii) with PDAC. Note positive staining for both TGF-β and BMP4 in normal islets (panel i), in PanINs and metaplastic ducts (panel ii), and in PDAC (panel iii). (C) Immunofluorescence staining for Smad2/3 (red) and Muc5ac (green) in a PanIN arising in a Pdx1-Cre LSL-KrasG12D mouse (region above dashed line; the PanIN lumen is marked with an asterisk). The ductal epithelial cells of the PanIN show cytoplasmic and membranous Muc5ac staining and nuclear localization of Smad2/3. (Inset) The stromal cells surrounding the PanIN epithelium also show nuclear Smad2/3. Nuclei are stained with DAPI (blue). (D) Western blot showing expression of phospho-Smad2/3 in a pancreas from a wild-type mouse (lane 1), from Pdx1-Cre LSL-KrasG12D mice (lanes 2,3), and in PDAC from a Pdx1-Cre LSL-KrasG12D Ink4a/Arflox/lox mouse (lane 4). (E) RT–PCR analysis of TGF-β1, BMP4, and actin expression in pancreata from wild-type mice (lanes 1,2), Pdx1-Cre LSL-KrasG12D mice (lanes 3,4), and in PDAC from Pdx1-Cre LSL-KrasG12D Ink4a/Arflox/lox mice (lanes 5,6). Magnifications: A (panels i,iii), B (panels i,iii), 100×; A (panels ii,iii [inset]), B (panels ii,iii [inset]), 200×; C, 630×.
Figure 3.
Figure 3.
Smad4 suppresses KrasG12D-driven pancreatic tumorigenesis. (A) Survival curve (Kaplan-Meier) of the Pdx1-Cre LSL-KrasG12D, Ptf1a-Cre LSL-KrasG12D Smad4lox/lox, and Pdx1-Cre LSL-KrasG12D Smad4lox/lox cohorts. (BI) Pancreatic tumorigenesis in Ptf1a-Cre LSL-KrasG12D Smad4lox/lox mice. (B) Gross photo of cystic pancreatic tumor in a 14-wk-old mouse. C and D show H&E images of the pancreas in B demonstrating regions of IPMN adenoma (C), borderline IPMN (D), and IPMN with carcinoma (E) in situ (arrows). (F) H&E image from 17-wk-old mouse showing PDAC with moderately differentiated ductal histology. (GI) IHC of normal pancreas (left panels) and IPMN (right panels) staining for Muc1 (G), Muc4 (H), and Muc5AC (I). Magnifications: C–I, 100×; C (inset), 200×; insets in E,F, 400×.
Figure 4.
Figure 4.
Comparison of evolving pancreatic lesions in LSL-KrasG12D mice with intact or deleted Smad4 alleles. (A) Pancreas specimens from 4-wk-old Ptf1-Cre LSL-KrasG12D (panels iiv) and Ptf1-Cre LSL-KrasG12D Smad4lox/lox (panels vvii) mice were stained with H&E (panels i,v) and with antibodies to cytokeratin-19 (panels ii,vi), Sonic Hedgehog (panels iii,vii) and Hes1 (panels iv,viii). The arrows point to pancreatic ductal lesions. (B) Morphometric analysis of pancreata from 4- to 5-wk-old Ptf1-Cre LSL-KrasG12D and Ptf1-Cre LSL-KrasG12D Smad4lox/lox mice (see Materials and Methods). (Left panel) Graph of number of ductal lesions per 100× field. (Right panel) Graph of number of ductal lesions per 100× field measuring >400 μm at greatest diameter. Six mice per genotype were analyzed with a minimum of eight fields counted per mouse. (C) H&E-stained pancreas from 8-wk-old Ptf1-Cre LSL-KrasG12D (panel i) and Ptf1-Cre LSL-KrasG12D Smad4lox/lox (panel ii) mice. Magnifications: A (panels iiii,vvii), C (panels i,ii), 50×; A (insets in panels i,v), 200×; A (insets in panels iii,vii), 400×.
Figure 5.
Figure 5.
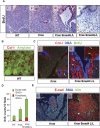
Smad4 deficiency cooperates with KrasG12D to promote epithelial and stromal expansion. (A) BrdU labeling of pancreata from wild-type (panel i), Ptf1-Cre LSL-KrasG12D (panel ii), and Ptf1-Cre LSL-KrasG12D Smad4lox/lox (panel iii) mice. (Panel iv) High-power view of proliferating epithelial and stromal cells (circled) in evolving PanIN from Ptf1-Cre LSL-KrasG12D Smad4lox/lox mice. (B) Immunofluorescence staining of wild-type mouse pancreas with antibodies against amylase (green) and collagen-1 (red) demonstrating the periacinar location of pancreatic fibroblasts. (C) Staining of ductal lesions from Ptf1-Cre LSL-KrasG12D (panel i) and Ptf1-Cre LSL-KrasG12D Smad4lox/lox (panel ii) mice with DBA lectin (blue) and with antibodies to collagen-1 (red) and BrdU (green) reveals proliferation in both the PanIN epithelium and fibroblastic components. (Panel ii) Inset is a high-power view showing fibroblast proliferation (arrows). (D) Graph of number of BrDU-positive epithelial and fibroblast cells per 200× field; three mice per genotype were analyzed. (E) Immunofluorescence staining of pancreata from 4-wk-old Ptf1-Cre LSL-KrasG12D (panel i) and Ptf1-Cre LSL-KrasG12D Smad4lox/lox (panel ii) mice with antibodies to E-cadherin (red), smooth muscle actin (blue), and vimentin (green). Magnifications: H (panels i,ii), 50×; AC,F (panels i,ii), 100×; C, inset, 200×; D,E, 400×.
Figure 6.
Figure 6.
Smad4 deletion promotes the glandular PDAC in cooperation with KrasG12D activation and Ink4a/Arf deficiency. (A) Kaplan-Meier analysis showing pancreas tumor-free survival of Ptf1a-Cre LSL-KrasG12D Ink4a/Arflox/+ Smad4lox/lox mice and Ptf1a-Cre LSL-KrasG12D Ink4a/Arflox/+ Smad4+/+ mice. Twelve of 13 deaths in the Ptf1a-Cre LSL-KrasG12D Ink4a/Arflox/+ Smad4lox/lox mice were due to PDAC, and one out of 13 was due to IPMN. (B) PDAC arising in a Ptf1a-Cre LSL-KrasG12D Ink4a/Arflox/+ Smad4lox/lox mouse (indicated by dashed line); note the liver metastases (white arrowheads). This mouse also showed an IPMN (denoted by asterisks). (C) Western blot analysis of lysates from early passage PDAC cell lines from the Ptf1a-Cre LSL-KrasG12D Ink4a/Arflox/+ Smad4+/+ (lanes 26) and Ptf1a-Cre LSL-KrasG12D Ink4a/Arflox/+ Smad4lox/lox (lanes 79) models for expression of Smad4, p19Arf, p16Ink4a, and tubulin. Lane 1 shows positive controls. (D) Undifferentiated PDAC from a Ptf1a-Cre LSL-KrasG12D Ink4a/Arflox/+ mouse (panels iiv) and a moderately differentiated PDAC from a Ptf1a-Cre LSL-KrasG12D Ink4a/Arflox/+ Smad4lox/lox mouse (panels vviii) stained with H&E (panels i,v), or with antibodies to cytokeratin-19 (panels ii,vi) and E-cadherin (panel iii,vii), and double-labeled with antibodies to E-cadherin (red) and Slug (green) (panels iv,viii). Magnifications: All are 100× except D (panel iv, inset), which is 630×.
Figure 7.
Figure 7.
Retention of epithelial differentiation in Smad4-deficient PDAC. (A) Western blot showing E-cadherin (top panel) and slug expression (middle panel) in PDAC cell lines from Cre LSL-KrasG12D Ink4a/Arflox/lox Smad4+/+ mice (lanes 15) and Cre LSL-KrasG12D Ink4a/Arflox/lox Smad4lox/lox (lanes 69) mice. (B) qRT–PCR for E-cadherin expression in primary PDAC from Cre LSL-KrasG12D Ink4a/Arflox/+ Smad4+/+ mice and Cre LSL-KrasG12D Ink4a/Arflox/+ Smad4lox/lox mice. (C) IHC analysis of S100A4 expression in PDAC from a Ptf1-Cre LSL-KrasG12D Ink4a/Arflox/+ Smad4+/+ mouse and a Ptf1-Cre LSL-KrasG12D Ink4a/Arflox/+ Smad4lox/lox mouse; note the staining of stromal fibroblasts in both genotypes (arrows) and staining of tumor glands in the Smad4+/+ tumors but not those lacking Smad4 (asterisks).
Figure 8.
Figure 8.
Smad4 status modulates TGF-β responses in PDAC. (A) H&E-stained sections showing PDAC histology (left panels), and images of derivative cell lines either mock-treated (center) or exposed to 5 μg/mL TGF-β (right panels) from Smad4 wild-type undifferentiated tumors (panel i), Smad4 wild-type ductal tumors (panel ii), and Smad4-null tumors (panel iii). Note that TGF-β enhances growth in panel i and inhibits in panel ii while no effect is seen in panel iii. Magnifications, 100×. (B) Growth curves of Smad4+/+ PDAC cell lines in 0.5% serum in the presence or absence of 5 μg/mL TGF-β. (C) Graphs of scratch assay measuring cell migration as relative wound closure after 16 h in the presence or absence of TGF-β1.
Figure 9.
Figure 9.
Smad4 expression restores TGF-β-responsiveness in Smad4-deficient PDAC cell lines. (A) Western blot analysis for Smad4 expression in PDAC cell lines from Pdx1-Cre LSL-KrasG12D Ink4a/Arflox/+ and Pdx1-Cre LSL-KrasG12D Ink4a/Arflox/+ Smad4lox/lox mice that were transduced with retroviruses expressing Smad4 or GFP. (B) Growth curves of the transduced PDAC cell lines in the presence or absence of TGF-β. (C) Morphology of PDAC cells with or without TGF-β treatment. The cells were photographed after 5 d of treatment with TGF-β or vehicle. (D) Impact of TGF-β administration on E-cadherin localization. E-cadherin staining is lost at the cellular junctions following TGF-β treatment in PDAC cell lines with intact Smad4 but not in cell lines with Smad4 inactivation.

Comment in

Similar articles

Cited by

References

    1. Adsay, N.V., Merati, K., Basturk, O., Iacobuzio-Donahue, C., Levi, E., Cheng, J.D., Sarkar, F.H., Hruban, R.H., Klimstra, D.S. Pathologically and biologically distinct types of epithelium in intraductal papillary mucinous neoplasms: Delineation of an ‘intestinal’ pathway of carcinogenesis in the pancreas. Am. J. Surg. Pathol. 2004;28:839–848. - PubMed
    1. Aguirre, A.J., Bardeesy, N., Sinha, M., Lopez, L., Tuveson, D.A., Horner, J., Redston, M.S., DePinho, R.A. Activated Kras and Ink4a/Arf deficiency cooperate to produce metastatic pancreatic ductal adenocarcinoma. Genes & Dev. 2003;17:3112–3126. - PMC - PubMed
    1. Apte, M.V., Park, S., Phillips, P.A., Santucci, N., Goldstein, D., Kumar, R.K., Ramm, G.A., Buchler, M., Friess, H., McCarroll, J.A., et al. Desmoplastic reaction in pancreatic cancer: Role of pancreatic stellate cells. Pancreas. 2004;29:179–187. - PubMed
    1. Bardeesy, N., Morgan, J., Sinha, M., Signoretti, S., Srivastava, S., Loda, M., Merlino, G., DePinho, R.A. Obligate roles for p16(Ink4a) and p19(Arf)–p53 in the suppression of murine pancreatic neoplasia. Mol. Cell. Biol. 2002a;22:635–643. - PMC - PubMed
    1. Bardeesy, N., Sinha, M., Hezel, A.F., Signoretti, S., Hathaway, N.A., Sharpless, N.E., Loda, M., Carrasco, D.R., DePinho, R.A. Loss of the Lkb1 tumour suppressor provokes intestinal polyposis but resistance to transformation. Nature. 2002b;419:162–167. - PubMed

Publication types

Substances

  NODES
admin 1
chat 1
Note 5
twitter 2