Innovation and robustness in complex regulatory gene networks
- PMID: 17690244
- PMCID: PMC1959426
- DOI: 10.1073/pnas.0705396104
Innovation and robustness in complex regulatory gene networks
Abstract
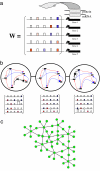
The history of life involves countless evolutionary innovations, a steady stream of ingenuity that has been flowing for more than 3 billion years. Very little is known about the principles of biological organization that allow such innovation. Here, we examine these principles for evolutionary innovation in gene expression patterns. To this end, we study a model for the transcriptional regulation networks that are at the heart of embryonic development. A genotype corresponds to a regulatory network of a given topology, and a phenotype corresponds to a steady-state gene expression pattern. Networks with the same phenotype form a connected graph in genotype space, where two networks are immediate neighbors if they differ by one regulatory interaction. We show that an evolutionary search on this graph can reach genotypes that are as different from each other as if they were chosen at random in genotype space, allowing evolutionary access to different kinds of innovation while staying close to a viable phenotype. Thus, although robustness to mutations may hinder innovation in the short term, we conclude that long-term innovation in gene expression patterns can only emerge in the presence of the robustness caused by connected genotype graphs.
Conflict of interest statement
The authors declare no conflict of interest.
Figures


Similar articles
-
Robustness and innovation in synthetic genotype networks.Nat Commun. 2023 Apr 28;14(1):2454. doi: 10.1038/s41467-023-38033-3. Nat Commun. 2023. PMID: 37117168 Free PMC article.
-
Genotype networks, innovation, and robustness in sulfur metabolism.BMC Syst Biol. 2011 Mar 7;5:39. doi: 10.1186/1752-0509-5-39. BMC Syst Biol. 2011. PMID: 21385333 Free PMC article.
-
The role of robustness in phenotypic adaptation and innovation.Proc Biol Sci. 2012 Apr 7;279(1732):1249-58. doi: 10.1098/rspb.2011.2293. Epub 2012 Jan 4. Proc Biol Sci. 2012. PMID: 22217723 Free PMC article. Review.
-
The molecular origins of evolutionary innovations.Trends Genet. 2011 Oct;27(10):397-410. doi: 10.1016/j.tig.2011.06.002. Epub 2011 Aug 27. Trends Genet. 2011. PMID: 21872964 Review.
-
The topology of robustness and evolvability in evolutionary systems with genotype-phenotype map.J Theor Biol. 2014 Sep 7;356:144-62. doi: 10.1016/j.jtbi.2014.04.014. Epub 2014 Apr 30. J Theor Biol. 2014. PMID: 24793533
Cited by
-
The influence of assortativity on the robustness and evolvability of gene regulatory networks upon gene birth.J Theor Biol. 2013 Aug 7;330:26-36. doi: 10.1016/j.jtbi.2013.03.019. Epub 2013 Mar 28. J Theor Biol. 2013. PMID: 23542384 Free PMC article.
-
In silico evolution of gene cooption in pattern-forming gene networks.ScientificWorldJournal. 2012;2012:560101. doi: 10.1100/2012/560101. Epub 2012 Dec 25. ScientificWorldJournal. 2012. PMID: 23365523 Free PMC article.
-
Control of complex networks requires both structure and dynamics.Sci Rep. 2016 Apr 18;6:24456. doi: 10.1038/srep24456. Sci Rep. 2016. PMID: 27087469 Free PMC article.
-
Why and how genetic canalization evolves in gene regulatory networks.BMC Evol Biol. 2016 Nov 8;16(1):239. doi: 10.1186/s12862-016-0801-2. BMC Evol Biol. 2016. PMID: 27821071 Free PMC article.
-
Analysis of gene network robustness based on saturated fixed point attractors.EURASIP J Bioinform Syst Biol. 2014 Mar 20;2014(1):4. doi: 10.1186/1687-4153-2014-4. EURASIP J Bioinform Syst Biol. 2014. PMID: 24650364 Free PMC article.
References
-
- Grant P. Ecology and Evolution of Darwin's Finches. Princeton: Princeton Univ Press; 1986.
-
- Piatigorsky J, Wistow GJ. Cell. 1989;57:197–199. - PubMed
-
- Gerhart J, Kirschner M. Cells, Embryos, and Evolution. Boston: Blackwell; 1998.
-
- Rechenberg I. Evolutionsstrategie. Stuttgart, Germany: Frommann–Holzboog; 1973.
-
- Keymeulen D, Zebulum R, Jin Y, Stoica A. IEEE Trans Rel. 2000;49:305–316.
Publication types
MeSH terms
Grants and funding
LinkOut - more resources
Full Text Sources

