RhoBTB2 (DBC2) is a mitotic E2F1 _target gene with a novel role in apoptosis
- PMID: 18039672
- PMCID: PMC2268526
- DOI: 10.1074/jbc.M705986200
RhoBTB2 (DBC2) is a mitotic E2F1 _target gene with a novel role in apoptosis
Abstract
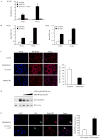
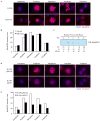
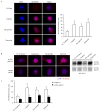
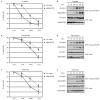
We have identified the RhoBTB2 putative tumor suppressor gene as a direct _target of the E2F1 transcription factor. Overexpression of E2F1 led to up-regulation of RhoBTB2 at the level of mRNA and protein. This also occurred during the induction of E2F1 activity in the presence of cycloheximide, thus indicating that RhoBTB2 is a direct _target. RNAi-mediated knockdown of E2F1 resulted in decreased RhoBTB2 protein expression, demonstrating that RhoBTB2 is a physiological _target of E2F1. Because E2F1 primarily serves to transcribe genes involved in cell cycle progression and apoptosis, we explored whether RhoBTB2 played roles in either of these processes. We found RhoBTB2 expression highly up-regulated during mitosis, which was partially dependent on the presence of E2F1. Furthermore, overexpression of RhoBTB2 induced a short term increase in cell cycle progression and proliferation, while long term expression had a negative effect on these processes. We similarly found RhoBTB2 up-regulated during drug-induced apoptosis, with this being primarily dependent on E2F1. Finally, we observed that knockdown of RhoBTB2 levels via siRNA delayed the onset of drug-induced apoptosis. Collectively, we describe RhoBTB2 as a novel direct _target of E2F1 with roles in cell cycle and apoptosis.
Figures


Similar articles
-
Ectopic expression of RhoBTB2 inhibits migration and invasion of human breast cancer cells.Cancer Biol Ther. 2010 Dec 1;10(11):1115-22. doi: 10.4161/cbt.10.11.13431. Epub 2010 Dec 1. Cancer Biol Ther. 2010. PMID: 20930524
-
RhoBTB2 (DBC2) functions as tumor suppressor via inhibiting proliferation, preventing colony formation and inducing apoptosis in breast cancer cells.Gene. 2011 Oct 15;486(1-2):74-80. doi: 10.1016/j.gene.2011.07.018. Epub 2011 Jul 23. Gene. 2011. PMID: 21801820
-
A novel tumor suppressor gene RhoBTB2 (DBC2): frequent loss of expression in sporadic breast cancer.Mol Carcinog. 2010 Mar;49(3):283-9. doi: 10.1002/mc.20598. Mol Carcinog. 2010. PMID: 19937980
-
Translating DNA damage into cancer cell death-A roadmap for E2F1 apoptotic signalling and opportunities for new drug combinations to overcome chemoresistance.Drug Resist Updat. 2010 Aug-Oct;13(4-5):119-31. doi: 10.1016/j.drup.2010.06.001. Epub 2010 Aug 1. Drug Resist Updat. 2010. PMID: 20675184 Review.
-
[Neurodevelopmental impact of a mutation in the RHOBTB2 gene].Rev Med Liege. 2024 Jul;79(7-8):467-470. Rev Med Liege. 2024. PMID: 39129541 Review. French.
Cited by
-
Characterization of RhoBTB-dependent Cul3 ubiquitin ligase complexes--evidence for an autoregulatory mechanism.Exp Cell Res. 2008 Nov 15;314(19):3453-65. doi: 10.1016/j.yexcr.2008.09.005. Epub 2008 Sep 20. Exp Cell Res. 2008. PMID: 18835386 Free PMC article.
-
Identifying a prognostic model and screening of potential natural compounds for acute myeloid leukemia.Transl Cancer Res. 2023 Jun 30;12(6):1535-1551. doi: 10.21037/tcr-22-2500. Epub 2023 May 29. Transl Cancer Res. 2023. PMID: 37434693 Free PMC article.
-
The precision medicine process for treating rare disease using the artificial intelligence tool mediKanren.Front Artif Intell. 2022 Sep 30;5:910216. doi: 10.3389/frai.2022.910216. eCollection 2022. Front Artif Intell. 2022. PMID: 36248623 Free PMC article.
-
Expression analysis of mouse Rhobtb3 using a LacZ reporter and preliminary characterization of a knockout strain.Histochem Cell Biol. 2014 Nov;142(5):511-28. doi: 10.1007/s00418-014-1235-9. Epub 2014 Jun 13. Histochem Cell Biol. 2014. PMID: 24923387
-
Molecular basis and current insights of atypical Rho small GTPase in cancer.Mol Biol Rep. 2024 Jan 18;51(1):141. doi: 10.1007/s11033-023-09140-7. Mol Biol Rep. 2024. PMID: 38236467 Review.
References
-
- Bracken AP, Ciro M, Cocito A, Helin K. Trends Biochem Sci. 2004;29(8):409–417. - PubMed
-
- DeGregori J, Johnson DG. Curr Mol Med. 2006;6(7):739–748. - PubMed
-
- Johnson DG, Degregori J. Curr Mol Med. 2006;6(7):731–738. - PubMed
-
- Cam H, Dynlacht BD. Cancer Cell. 2003;3(4):311–316. - PubMed
-
- Harbour JW, Dean DC. Genes Dev. 2000;14(19):2393–2409. - PubMed
Publication types
MeSH terms
Substances
Grants and funding
LinkOut - more resources
Full Text Sources

