. 2005 Nov 15;194(48-49):5083-5106.
doi: 10.1016/j.cma.2004.11.026.

3D Finite Element Meshing from Imaging Data

Affiliations

3D Finite Element Meshing from Imaging Data

Yongjie Zhang et al. Comput Methods Appl Mech Eng. .

Abstract

This paper describes an algorithm to extract adaptive and quality 3D meshes directly from volumetric imaging data. The extracted tetrahedral and hexahedral meshes are extensively used in the Finite Element Method (FEM). A top-down octree subdivision coupled with the dual contouring method is used to rapidly extract adaptive 3D finite element meshes with correct topology from volumetric imaging data. The edge contraction and smoothing methods are used to improve the mesh quality. The main contribution is extending the dual contouring method to crack-free interval volume 3D meshing with feature sensitive adaptation. Compared to other tetrahedral extraction methods from imaging data, our method generates adaptive and quality 3D meshes without introducing any hanging nodes. The algorithm has been successfully applied to constructing the geometric model of a biomolecule in finite element calculations.


Figures

Fig. 1
Fig. 1
Adaptive tetrahedral meshes are extracted from a CT-scanned volumetric data(UNC Head). Depending on the selected isovalues, different meshes of a skin and a skull are constructed. The number of tetrahedra can be controlled by choosing a user specified error tolerance (tet# - (b) 935124, (c) 545269, (d) 579834, (e) 166271). Note that the extracted mesh has no crack and no hanging node.
Fig. 2
Fig. 2
The contour spectrum of the UNC human head
Fig. 3
Fig. 3
Uniform triangulation - the red curve represents the isocontour, green points represent minimizers.
Fig. 4
Fig. 4
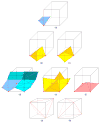
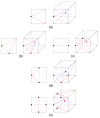
The case table of uniform tetrahedralization - the red vertex means it lies interior to the interval volume, otherwise, it is outside. Green points represent minimizers. (a) - a sign change edge; (b)(c) - an interior edge in a boundary cell; (d)(e)(f) - an interior face in a boundary cell; (g)(h) - an interior cell.
Fig. 5
Fig. 5
A two dimensional example of cell subdivision for enforcing each cell to have at most one boundary isocontour. When two boundary isocontours pass through the same cell, the cell is recursively subdivided until each sub-cell contains at most one minimizer.
Fig. 6
Fig. 6
Hanging node removal - the red point is a hanging node. (a) - T-Vertex; (b) - merging two triangles; (c) - splitting method. (d) and (e) show an example of hanging node removal by re-triangulating the interior cell (pink). The red curve is the real isocontour, and green points are minimizer points for boundary cells. (d) - the triangulation of the interior cell without considering the hanging node; (e) - the re-triangulation of the interior cell to remove the hanging node.
Fig. 7
Fig. 7
Left: adaptive triangulation. The red curve represents the isocontour, green points represent minimizers. Right: The case table for decomposing the interior cell into triangles in 2D. Suppose the resolution level of this cell is κ, and middle points appear on the shared edges if its neighbors have higher level than κ. Red points and red lines mean its neighbors have level (κ+1); green points and green lines mean its neighbors have higher level than (κ+ 1). The case table can be easily generalized to any other adaptive cases.
Fig. 8
Fig. 8
The case table for decomposing the interior cell into tetrahedra when the neighboring level difference is one – in (a ∼ e), the left picture shows the triangulation format of one face according to Figure 7; the right one shows how to decompose the cell into tetrahedra without hanging nodes. (a) - one subdivided edge; (b)(c) - two subdivided edges; (d) - three subdivided edges; (e) - four subdivided edges. Any other adaptive cases are easily generalized using the case table in Figure 7.
Fig. 9
Fig. 9
Tetrahedral/hexahedral meshes of the human head model - (a) and (b) show adaptive tetrahedral meshes, (c) and (d) show the hexahedral meshes. (a): the tetrahedralization of the volume inside the head; (b): a cross section of (a); (c): the hexahedralization of the volume between the human head and a sphere boundary; (d): the hexahedralization of the volume inside the head.
Fig. 10
Fig. 10
A two dimensional example on the recursive subdivision of a cubic cell in the finest level for reconstructing a dual contour with correct topology.
Fig. 11
Fig. 11
(a)-(d): An example of an ambiguous case for a finest-level cell. Both the front-right-up and back-left-down vertices have the positive sign, all the other vertices have the negative sign. (a): A non-manifold dual contour is generated in a cube with an ambiguous case. In this case, the real isosurface in the cube is topologically equivalent to either two simple disks (b) or a tunnel (c) [38]. The topologically correct dual contours, (b) and (c), can be constructed by the simple subdivision of a cell in (a). (d) is displayed in a different view angle from (c) to emphasize that the tunnel shape is correctly reconstructed. (e)-(f): A real example (the human knee) on topologically correct reconstruction of a dual contour. (e): before subdivision, (f): after subdivision. Note that non-manifolds in (e) are removed in (f).
Fig. 12
Fig. 12
Sampling points for the feature sensitive error function (Left - Level (i); Middle - Level (i+1).) and the isosurface error calculation in 1D (Right). In the right picture, the red curve represents the trilinear function in Level (i) (it becomes to a straight line in 1D), and the green straight line represents the tangent line of the trilinear function at the middle point.
Fig. 13
Fig. 13
(a), (b) : Tetrahedral meshes of (a) fandisk and (b) mechanical part. Note that sharp edges and corners are accurately reconstructed; (c) , (d) : the comparison of QEF ((c), 2952 triangles) and the feature sensitive error function ((d), 2734 triangles). The facial features are better refined in (d).
Fig. 14
Fig. 14
A special case for the edge-contraction method. Left - the original mesh, the red edge is to be contracted; Middle - the red edge is contracted; Right - the additional triangles are removed.
Fig. 15
Fig. 15
The histogram of edge-ratios (left) and Joe-Liu parameters (right) for mAChE and the human heart. The number of tetrahedra at edge-ratio 40.0 represents the number of all the elements, whose edge-ratios are greater than 40.0.
Fig. 16
Fig. 16
The comparison of the three quality criteria (the edge-ratio, the Joe-Liu parameter and the minimal volume) before/after the quality improvement for mAChE and the human heart model. DATAb – before quality improvement; DATAa – after quality improvement.
Fig. 17
Fig. 17
Datasets and Test Results. The CT data sets are re-sampled to fit into the octree representation. Rendering results for each case is shown in Figure 18, 19, 1, 20, 21 and 22. the Skull and Skin isosurfaces are extracted from the UNC Head model.
Fig. 18
Fig. 18
mAChE – (a): the isosurface at 0.5 from the accessibility function; (b): the wire frame of the isosurface and an outer sphere; (c): a zoomed-in picture to show the refined cavity; (d): the adaptive tetrahedral mesh of the volume between the isosurface and an outer sphere. The color on the isosurface represents the distribution of the potential function, the color map is: (-∞, -0.5) - red; [-0.5, 0.5] - white; (0.5, +∞) - blue. Note the region around the cavity has fine meshes, while other areas have relatively coarse meshes.
Fig. 19
Fig. 19
Heart (SDF) – (a): the triangular surface of a human heart with valves (data courtesy from New York University (NYU)); (b): The tetrahedral mesh extracted from SDF of the heart surface. The smooth surface and the wire frame on the mesh is rendered; (c): the wire frame of the extracted heart model. Note that the region of heart valves are refined; (d): Cross-section of the adaptive tetrahedral mesh.
Fig. 20
Fig. 20
Head (SDF) – Isovalues αin = -9,17464, αout = 0.0001; error tolerances εin = 1.7, εout are listed below each picture.
Fig. 21
Fig. 21
Knee (SDF) – Error tolerances εin = εout = 0.0001; isovalues αout = -0.02838, αin are listed below each picture.
Fig. 22
Fig. 22
Heart Valve (Poly) – Isovalues αin = 1000.0, αout = 75.0; error tolerances εin = 0.0001, εout are listed below each picture.

Similar articles

Cited by

References

    1. Bajaj C, Coyle E, Lin KN. Arbitrary topology shape reconstruction from planar cross sections. Graphical Modeling and Image Processing. 1996;58(6):524–543.
    1. Bajaj C, Coyle E, Lin KN. Tetrahedral meshes from planar cross sections. Computer Methods in Applied Mechanics and Engineering. 1999;179:31–52.
    1. Bajaj C, Pascucci V, Schikore D. Fast isocontouring for improved interactivity. Proceedings of the IEEE Symposium on Volume Visualization. 1996:39–46.
    1. Bajaj C, Pascucci V, Schikore D. The contour spectrum. IEEE Visualization. 1997:167–174.
    1. Bajaj C, Wu Q, Xu G. ICES Technical Report. Vol. 301. The Univ. of Texas at Austin; 2002. Level set based volume anisotropic diffusion.

LinkOut - more resources

  NODES
Note 6
twitter 2