. 2010 Oct 7;116(14):2462-71.
doi: 10.1182/blood-2009-12-259630. Epub 2010 Jun 25.

STAT3 controls myeloid progenitor growth during emergency granulopoiesis

Affiliations

STAT3 controls myeloid progenitor growth during emergency granulopoiesis

Huiyuan Zhang et al. Blood. .

Abstract

Granulocyte colony-stimulating factor (G-CSF) mediates "emergency" granulopoiesis during infection, a process that is mimicked by clinical G-CSF use, yet we understand little about the intracellular signaling cascades that control demand-driven neutrophil production. Using a murine model with conditional deletion of signal transducer and activator of transcription 3 (STAT3) in bone marrow, we investigated the cellular and molecular mechanisms of STAT3 function in the emergency granulopoiesis response to G-CSF administration or infection with Listeria monocytogenes, a pathogen that is restrained by G-CSF signaling in vivo. Our results show that STAT3 deficiency renders hematopoietic progenitor cells and myeloid precursors refractory to the growth-promoting functions of G-CSF or L monocytogenes infection. STAT3 is necessary for accelerating granulocyte cell-cycle progression and maturation in response to G-CSF. STAT3 directly controls G-CSF-dependent expression of CCAAT-enhancer-binding protein β (C/EBPβ), a crucial factor in the emergency granulopoiesis response. Moreover, STAT3 and C/EBPβ coregulate c-Myc through interactions with the c-myc promoter that control the duration of C/EBPα occupancy during demand-driven granulopoiesis. These results place STAT3 as an essential mediator of emergency granulopoiesis by its regulation of transcription factors that direct G-CSF-responsive myeloid progenitor expansion.


Figures

Figure 1
Figure 1
STAT3 regulates G-CSF–responsive proliferation of immature granulocytes and the kinetics of granulocyte maturation. (A) Immature Gr-1lo granulocytes were isolated from the bone marrow of wild-type (WT) and STAT3-deficient (KO) mice by fluorescence-activated cell sorting. Cells were labeled with CFSE, cultured in G-CSF (2.5 ng/mL) for 4 days, and analyzed by flow cytometry. Results of a representative experiment (1 of 3) are shown. (B) Gr-1lo cells were cultured in G-CSF (25 ng/mL) for the indicated times or analyzed directly after isolation (0 hour). Cells were stained with propidium iodide and analyzed by flow cytometry. The percentage of cells in S phase was determined by ModFit LT v3.0 (n = 3 for WT and KO for each condition). (C) Bone marrow Gr-1lo cells were isolated 4 hours after mice received a single dose of G-CSF (250 μg/kg; +) or BSA carrier alone (−). Gene expression was measured by quantitative PCR, with normalization to 18s RNA (n = 3 for WT and KO for each condition). (D) Gr-1lo cells were cultured in G-CSF for 2 or 4 days or analyzed directly after isolation (NT). The expression of neutrophil differentiation markers was measured at the indicated times by quantitative PCR (n = 3 for WT and KO for each condition). (B-D) Average values from 3 independent experiments are shown. Error bars represent SEM. *P < .05 compared with untreated or BSA-treated controls. **P < .01, ***P < .001 compared with control.
Figure 2
Figure 2
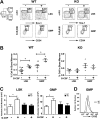
Role of STAT3 in hematopoietic progenitor responses to G-CSF. Wild-type (WT) and STAT3-deficient (KO) mice were injected with G-CSF (250 μg/kg; +) or BSA carrier alone (−), and bone marrow cells were collected 24 hours after treatment. (A) The proportion of LSKs and GMPs was determined by flow cytometry, as indicated. Data are representative of 3 independent experiments. (B) The frequency of LSKs (BSA, ●; G-CSF, ■) and GMPs (BSA, ▲; G-CSF, ▼) within individual mice is indicated for wild-type or STAT3-deficient animals. (C) Absolute numbers of bone marrow LSKs and GMPs in 2 femurs and 2 tibiae were determined by enumeration. (B-C) Average values from 3 independent experiments are shown. Error bars represent SEM (n = 8, WT BSA; n = 4, WT G-CSF; n = 5, KO BSA; n = 3, KO G-CSF). *P < .05 compared with BSA-treated controls. (D) GMPs from WT and STAT3-deficient mice were stained with CFSE, cultured in G-CSF for 3 days, and analyzed by flow cytometry. Data are representative of 3 independent experiments.
Figure 3
Figure 3
STAT3 controls hematopoietic progenitor responses during L monocytogenes infection. Wild-type (WT) or STAT3-deficient (KO) mice were infected with 20 000 colony-forming units of L monocytogenes by intravenous injection. (A) Immature Gr-1lo (Gr-1lo) and mature Gr-1hi (Gr-1hi) granulocytes were isolated from untreated controls (NT) or L monocytogenes–infected mice at 12 or 24 hours after infection, as indicated. Tyrosine-phosphorylated and total STAT3 was detected by immunoblotting, as shown. Data are representative of 3 independent experiments. (B) The frequency of LSKs was determined 12 hours after infection or in untreated controls (NT), as indicated. Results from a representative experiment (1 of 4) are shown. (C) LSK proportions within individual mice is indicated for untreated (−) or infected (+) WT or STAT3-deficient animals. The horizontal bar indicates average values, determined from 4 independent experiments. (D) Absolute numbers of LSKs in 2 femurs and 2 tibiae from untreated (−) or infected (+) mice were determined by enumeration (n = 7 for untreated WT; n = 6 for infected WT; n = 4 for untreated or infected KO). Average values are shown, determined from 4 independent experiments. (C-D) Error bars represent SEM. *P < .05 compared with untreated controls.
Figure 4
Figure 4
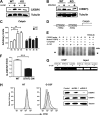
STAT3 directly regulates C/EBPβ expression during emergency granulopoiesis. (A-B) C/EBPβ expression was measured in Gr-1+ granulocytes isolated from wild-type (WT) and STAT3-deficient (KO) mice 6 hours after treatment with G-CSF (+) or BSA buffer (−) in vivo (A) or 24 hours after infection with L monocytogenes (+) or in untreated controls (−) (B). The dominant LAP (liver-enriched transcriptional activator protein) isoform of C/EBPβ was detected by immunoblotting. Tubulin was used as a loading control. Data are representative of 3 independent experiments. (C) Cebpb mRNA expression was measured in immature Gr-1lo granulocytes from WT or STAT3-deficient mice, after treatment with G-CSF ex vivo for 0 to 4 hours, using quantitative PCR (n = 3 for WT and KO for each condition). Average values from 3 independent experiments are shown. **P < .01 compared with control. (D) Schematic diagram of the murine Cebpb promoter, showing the location of 2 IL-6 RE II sites. (E) 32D.G-CSFR cells were stimulated with G-CSF (25 ng/mL) for 1 hour or left untreated, as indicated. Nuclear extracts were used in EMSAs with a radiolabeled oligonucleotide corresponding to the IL-6 RE II consensus sequence at position −1180 in the Cebpb promoter (C/EBPβ probe) or a mutant radiolabeled C/EBPβ oligonucleotide (mutant C/EBPβ) in the presence or absence of unlabeled competitor C/EBPβ probe (C), an unlabeled competitor oligonucleotide corresponding to the STAT3 consensus site in the murine Socs3 promoter (S), or STAT3 antibodies, as indicated. The migration positions of STAT3 dimers (*) and supershifted STAT3 complexes (**) are shown. Data are representative of 3 independent experiments. (F) 32D.G-CSFR cells were electroporated with pGL3-C/EBPβ, pTK-Renilla and pMX-STAT3 or pMX-STAT3 DN (DNA-binding mutant). After 24 hours, cells were treated with or without G-CSF for 2 hours and assayed for luciferase activity. The ratio of firefly:renilla relative light units (RLU) from G-CSF–treated and unstimulated cells (NT) was averaged from 3 independent experiments. Error bars represent SEM. (G) 32D.G-CSFR cells were treated as indicated in panel E. ChIPs were performed with STAT3 antibodies (STAT3 Ab) or an irrelevant IgG (Ig). PCR reactions were performed with primers specific for the murine Cebpb promoter on total cell lysates (input) or immunoprecipitated samples, as indicated. Data are representative of 3 independent experiments. (H) Wild-type Gr-1lo cells were infected with lentiviral shRNA vectors (control vector, gray shading; shRNA 1, dotted line; shRNA 2, black line), stained with CFSE, analyzed immediately (NT) by flow cytometry or cultured in G-CSF for 4 days (G-CSF), and evaluated by flow cytometry. Expression of C/EBPβ, C/EBPα, and tubulin was determined by immunoblotting. Data are representative of 3 independent experiments.
Figure 5
Figure 5
STAT3 controls c-myc expression during emergency granulopoiesis. (A) Wild-type (WT) or STAT3-deficient (KO) mice were treated with G-CSF or BSA as indicated in Figure 1. c-myc mRNA expression was determined in bone marrow LSK and GMP subsets isolated 24 hours after treatment or in immature Gr-1lo granulocytes at 4 hours after treatment, by quantitative PCR (n = 3 for WT and KO for each condition). (B) WT or STAT3-deficient mice were infected with L monocytogenes or left untreated. c-myc expression was analyzed in LSKs and GMPs purified 12 hours after infection, using quantitative PCR (n = 3 for WT and KO for each condition). (A-B) Average values from 3 independent experiments are shown. *P < .05, **P < .01, ***P < .001 compared with control. (C) 32D.G-CSFR cells were treated 0 to 6 hours with G-CSF; c-myc RNA was measured by quantitative PCR. Average values from 3 independent experiments are shown. ***P < .001 compared with control. (D) Nuclear extracts were generated from untreated (−) or G-CSF–treated (+) 32D.G-CSFR cells at the indicated times and used in EMSAs with a radiolabeled oligonucleotide corresponding to a putative STAT3 consensus site in the c-myc promoter (WT), a mutated radiolabeled c-myc promoter oligonucleotide (mutant), or a radiolabeled oligonucleotide corresponding to the STAT3 binding site in the murine Socs3 promoter (S). EMSAs were performed in the presence or absence of STAT3 antibodies or competitor WT oligonucleotides, as indicated. The migration positions of STAT3 dimers (*) and supershifted STAT3 complexes (**) are shown. Data are representative of 3 independent experiments. (E) 32D.G-CSFR cells were treated as indicated in Figure 4E. ChIPs were performed with STAT3 antibodies (STAT3) or an irrelevant IgG (Ig), as indicated, followed by PCR with primers specific for the murine c-myc promoter. Control PCR reactions were performed on total lysate (input). Data are representative of 3 independent experiments.
Figure 6
Figure 6
STAT3 modulates C/EBPα and C/EBPβ recruitment to the c-myc promoter in response to G-CSF. (A) A schematic diagram shows the location of putative STAT3, C/EBPα, and C/EBPβ binding sites in the murine c-myc promoter. (B) Sequence alignment of the murine, rat, and human c-myc promoter regions encompassing the putative STAT3, C/EBPα, and C/EBPβ binding sites. (C) Bone marrow cells from wild-type (WT) or STAT3-deficient (KO) mice were treated with G-CSF (25 ng/mL) for 1 hour or 6 hours, as indicated. ChIPs were performed with antibodies to STAT3, C/EBPβ, C/EBPα, or an irrelevant IgG (Ig). PCR reactions were performed with primers specific for the murine c-myc promoter region encompassing the putative STAT3, C/EBPα, and C/EBPβ binding sites, using immunoprecipitation or input samples, as indicated. Data are representative of 2 independent experiments. (D) Wild-type (WT) or STAT3-deficient (KO) mice were treated with G-CSF or BSA buffer in vivo. C/EBPα expression was determined in bone marrow Gr-1+ granulocytes at 6 hours after treatment by immunoblotting (n = 3 for WT and KO for each condition). Data are representative of 3 independent experiments. (E) 32D.G-CSFR cells were electroporated with pGL3-myc, pTK-Renilla, pMX-STAT3, and pMX-STAT3 DN as indicated. pRV-C/EBPβ or pRV-C/EBPα were included individually in some samples or in a 9:1, 1:1, or 1:9 ratio, as illustrated. Cells were treated with or without G-CSF for 2 hours and assayed for luciferase activity. Relative luciferase unit induction in G-CSF–treated vs unstimulated (NT) cells was averaged from 3 independent experiments. Error bars represent SEM.

Similar articles

Cited by

References

    1. Boxer L, Dale DC. Neutropenia: causes and consequences. Semin Hematol. 2002;39(2):75–81. - PubMed
    1. Eyles JL, Hickey MJ, Norman MU, et al. A key role for G-CSF-induced neutrophil production and trafficking during inflammatory arthritis. Blood. 2008;112(13):5193–5201. - PubMed
    1. von Vietinghoff S, Ley K. Homeostatic regulation of blood neutrophil counts. J Immunol. 2008;181(8):5183–5188. - PMC - PubMed
    1. Al-Gwaiz LA, Babay HH. The diagnostic value of absolute neutrophil count, band count and morphologic changes of neutrophils in predicting bacterial infections. Med Princ Pract. 2007;16(5):344–347. - PubMed
    1. McKinstry WJ, Li CL, Rasko JE, Nicola NA, Johnson GR, Metcalf D. Cytokine receptor expression on hematopoietic stem and progenitor cells. Blood. 1997;89(1):65–71. - PubMed

Publication types

MeSH terms

Substances

  NODES
admin 1
twitter 2