. 2011 Feb 15;19(2):257-72.
doi: 10.1016/j.ccr.2011.01.020.

Bone marrow-derived myofibroblasts contribute to the mesenchymal stem cell niche and promote tumor growth

Affiliations

Bone marrow-derived myofibroblasts contribute to the mesenchymal stem cell niche and promote tumor growth

Michael Quante et al. Cancer Cell. .

Abstract

Carcinoma-associated fibroblasts (CAFs) that express α-smooth muscle actin (αSMA) contribute to cancer progression, but their precise origin and role are unclear. Using mouse models of inflammation-induced gastric cancer, we show that at least 20% of CAFs originate from bone marrow (BM) and derive from mesenchymal stem cells (MSCs). αSMA+ myofibroblasts (MFs) are niche cells normally present in BM and increase markedly during cancer progression. MSC-derived CAFs that are recruited to the dysplastic stomach express IL-6, Wnt5α and BMP4, show DNA hypomethylation, and promote tumor growth. Moreover, CAFs are generated from MSCs and are recruited to the tumor in a TGF-β- and SDF-1α-dependent manner. Therefore, carcinogenesis involves expansion and relocation of BM-niche cells to the tumor to create a niche to sustain cancer progression.


Figures

Figure 1
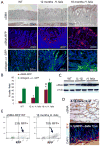
Figure 1. BM-derived αSMA-expressing cells contribute to the tumor microenvironment
(A) αSMA staining (upper panel) and endogenous αSMA-RFP (middle panel) or endogeneous collgen-α1 (lower panel) expression in stomachs of αSMA-RFP/collagen-α1-GFP double transgenic mice and following 12- or 18-month of H. felis infection. (B) Relative number of αSMA (red) or collagen (green) expressing cells in the stomach of αSMA-RFP/collagen-α1-GFP double transgenic mice without and with 12- or 18 months of H. felis infection, (*=p<0,05 compared to WT and #=p<0,05 compared to 12 month) (C) Western blot for αSMA and β-tubulin in gastric tissue of WT, IL-1β transgenic mice, and WT mice with 18 month of H. felis infection (D) αSMA staining in a dysplastic region in 12-month old IL-1β transgenic mice and 95% co-localization of endogenous RFP expression and αSMA in stomachs of 12 months old IL-1β/αSMA-RFP mice (E) FACS analysis of RFP+ gastric MF at 8 PD, isolated from uninfected αSMA-RFP mice (WT MF) or H. felis (18 mo) infected αSMA-RFP mice (18 months H. felis). All data are represented as mean +/− SEM (See also Figure S1)
Figure 2
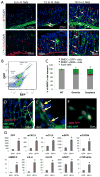
Figure 2. A significant portion of gastric CAFs originate from the bone marrow
(A) EGFP (lower panel) or RFP (upper panel) expression and co-staining for αSMA and DAPI in stomachs of WT or 12 and 18-month mice with H. felis infection (arrows indicate αSMA and GFP or RFP co-expression) after UBC-GFP- or αSMA-RFP-labeled BMT. (B) FACS of freshly isolated gastric MF from WT mice with double-labeled BMT after 18 months of H. felis infection. (C) FACS data on BM cell contribution to the tumor microenvironment in WT, IL-1β, and H. felis infected WT mice harboring gastritis or dysplasia. Green: non-αSMA+ BM-derived cells, red: αSMA+ BM-derived cells, grey: all non-BM-derived cells. (*=p< 0,05) (D, E) Endogenous RFP and GFP expression in stomach of 18 months H. felis infected WT mice after UBC-GFP/αSMA-RFP- double-labeled BM transplantation (F) Endogenous RFP and GFP expression in in vitro culture of isolated MF from stomachs of 18 months H. felis infected WT mice after UBC-GFP/αSMA-RFP- double-labeled BM transplantation (G) Gene expression data after FACS sorting of GFP(−) and GFP(+) CAFs from a BM-transplanted H. felis-infected IL-1β mouse. qRT-PCR for expression of GFP, CXCL1, CCL5, SSP1, CXCR4, MMP9, IL-6, IL-1β, SDF-1α, and TNFa (copies are calculated per 10000 copies of GAPDH, *=p<0.05 compared to all other cells). All data are represented as mean +/− SEM. (See also Figure S2 and Table S1)
Figure 3
Figure 3. In a mixed population of MSCs the αSMA-RFP- cells contain the stem cells and RFP+ cells express a typical MF marker
(A) FACS for αSMA-RFP+ cells in freshly isolated whole BM of 6, 9, 12, 15 and 18 month old αSMA-RFP+ mice and αSMA-RFP+ mice with H. felis infection (red) and 6, 12 and 15 month old IL-1β/αSMA-RFP+ transgenic mice (green) and 6, 9 and 12 month old αSMA-RFP+ mice with H. felis infection and MNU treatment (purple). (B) αSMA and RFP staining of the BM of C57/B6 (lower row) or αSMA-RFP (upper row) mice before (control) and after 14 months of H. felis infection. Arrows indicate cells staining positive. (*=p< 0,05, data are represented as mean +/− SEM) See also Figure S3 and Table S2 (C) CFUs from 1000 plated RFP+ (red), RFP- (green) or RFP+/− (black) cells were counted after 14 days culture. (D) Adipocyte (brown) and osteoblast (orange) differentiation of RFP+, RFP- or RFP+/− cells was measured after 14 days culture in differentiation mediua. After Oil Red-O or Alizarin Red staining % of differentiated cells was calculated. (E) Representative pictures of RFP+/− cells after differentiation experiments (left as control) and after adipocyte (middle, with Oil Red-O staining) or osteoblast (right with Alizarin Red staining) differentiation. (F) Quantitative expression of αSMA or collagen in RFP+ (red), RFP- (green) or RFP+/− (black) cells at passage 5 after a single RFP sorting. (G) Representative pictures of αSMA, FSP1, collagen, and vimentin staining in RFP+, RFP− or RFP+/− cells. (*=p< 0.05, **=p<0.01 data are represented as mean +/− SEM) (See also Figure S3)
Figure 4
Figure 4. αSMA-RFP- stem cells give rise to their αSMA-RFP+ niche cells
(A) After sorting of αSMA-RFP+ MSCs after 6 PD, RFP- cells (upper panel) and RFP+ cells (lower panel) were cultured separately and RFP expression of each population was determined. Pictures below the FACS blots represent each respective population. (B) PD of RFP+ (red), RFP- (green), RFP+/− (black) and RFP- cells after multiple sorting to eliminate RFP+ cells (light green). RFP expression status is shown in the red bar below the graph (* indicate potential tetraploidy after more than 80 days in in vitro culture). (C) Elimination of RFP+ cells through TK-ablation: Freshly isolated MSCs (adherent BM cultures) from αSMA-RFP mice were transfected with an αSMA-TK construct and treated with 50μM gancyclovir. Remaining RFP- cells only proliferated after the treatment and gave rise to any RFP+ cells when cultured on feeder cells (lower panel). Data are represented as mean +/− SEM (D) Schematic illustration of the results: MSC (RFP- cells) give rise to MSCs and MF (RFP+ cells). After sorting, RFP+ cells become senescent after few PDs. RFP- cells can give rise to its niche cells, RFP+ MF, and generate a heterogeneous MSC population, consisting of RFP+ and RFP- cells. (E) Representative time-lapse microscopy images of a RFP- cell (black arrow) giving rise to RFP- (black arrow) and RFP+ (red arrow) cells in a population of RFP+/− cells. Elapsed time (from start of the microscopy, 12h after seeding) is indicated. (See also Movie S1, Table S2, and Figure S4)
Figure 5
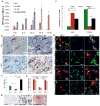
Figure 5. Regulation of the stem cell niche in the BM and tumor
(A) Percentages of RFP+ cells in populations of RFP+ (red), RFP- (green), and RFP+/− (black) cells after incubation with TGF-β or PDGF. (B) Results of ELISA for SDF-1α expression in RFP+, RFP-, RFP+/−, and WT gastric MF with and without incubation with TGF-β or PDGF. (C) Gene expression data from bone marrow MSC cultures (RFP+, RFP−, RFP+/−), CAFs and WT MF. qRT-PCR for expression of IL-6, SDF-1a, TGF-β, BMP4, Wnt5a, Shh, Dkk1, Gremlin 1 and CXCR4 from in vitro culture of RFP-, RFP+, RFP+/− cells, gastric RFP+ CAFs and WT gastric MF as a control. (copies are calculated per 10000 copies of GAPDH, * = p<0.05 compared to all other cells, # = p<0.05 compared to RFP- cells, $ = p<0.05 compared to RFP+ cells, + = p<0.05 compared to MF (Dunnett test for multiple comparisons)). (D) Quantitative analysis of the dose-dependent effect on RFP expression in RFP+/− after 48h incubation with TGF-β and 100ng/ml (left) or 1ug/ml (right) of the CXCR4 inhibitor AMD3100. (E) qRT-PCR for Gremlin-1 expression in RFP+, RFP-, and RFP+/− cells with (red) and without (blue) 48h incubation with TGF-β. (F) Representative picture of Gremlin-1 staining of WT mouse stomach (left) and mouse stomach with gastric dysplasia after 14 months of H. felis infection (middle), and invasive gastric cancer in 14-month old IL-1β mice (right). (G) Representative pictures of Gremlin-1 staining (green) of RFP+/− and RFP- cells (left, RFP [red] is endogeneous αSMA-RFP). Control stomach (lower panel, right) and stomach with gastric dysplasia after 14 months of H. felis infection (lower panel, right) are shown. (H) Representative double staining for Gremlin-1 (red) and αSMA (green) in gastric dysplasia in 18 months H. felis infected mice (I and J) Representative picture of Gremlin1 (I) and Nestin1 (J) staining in 12 months old GFP-BM transplanted IL-1β mice (*=p< 0,05, all data are represented as mean +/− SEM) (See also Figure S5)
Figure 6
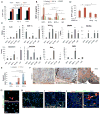
Figure 6. MF differentiation of MSC promotes in vitro tumor invasion
(A) % change of αSMA and collagen expression in RFP-, RFP+, and RFP+/− cells co-cultured with AGS or MKN45 gastric tumor cells (see Figure 3d for controls, *= p< 0,05) (B) Results of ELISA for SDF-1α expression in RFP+, RFP-, and RFP+/− cells in single or co-culture with AGS gastric tumor cells (C) Quantification of invasions per 1cm from organotypic culture experiments of in RFP−, RFP+, and RFP+/− cells of WT MF and IL-1β-BM MF grown in a 3D collagen/Matrigel matrix with AGS on top. (*=p< 0,05 compared to WT MF and #= p<0.05 compared to RFP+/− or IL-1β MF) (D) Representative pictures of organotypic culture with AGS cells growing on top of a 3-D collagen/Matrigel matrix that contains different cell populations. Upper panel: RFP+ cells (arrows indicate invasion sites) with representative pictures of the staining for human epithelial antigen (hEA) to detect human AGS cells (middle) or αSMA to detect the αSMA-RFP expressing cells in the matrix (arrows at right). Middle panel: AGS cells on RFP- (left) or RFP+/− (middle) cells, and on RFP+/− cells after incubation with 5-azacytidine (35ul/ml) for 10 days. Lower panel: Left panel shows IL-1β BM MF; middle panel shows isolated gastric MF from WT mice with 18 months of H. felis infection; right panel shows WT, uninfected gastric MF (arrows indicate invasion sides). (E) Relative methylation in the cytosine extension assay of RFP+/− and RFP+ cells compared to RFP+/− cells treated with TGF-β for 48h. (F) FACS for RFP expression in RFP+/− cells before (left) and after (right) incubation with 5-azacytidine for 10 days and 6 PD (*=p< 0,05). All data are represented as mean +/− SEM)
Figure 7
Figure 7. BM-derived gastric MF and heterogeneous MSC promote xenograft tumor growth that can be inhibited by TGF-β or CXCR4
(A) For xenograft experiments, 105 RFP+ (upper row), RFP+/− (second row), IL-1β-BM MF (third row), and gastric RFP+ CAFs (lower row) were co-injected with 105 MKN45 cells on the right flank and 105 MKN45 cells were injected alone on the left flank of SCID mice. Tumor injection sites and tumor sizes after isolation are shown. Left or right side shows representative images of staining for αSMA and RFP (upper 2 rows). The third row shows tumors of αSMA and RFP and representative IHC for GFP, αSMA and DAPI (lower panel, orange arrows indicate double staining and white arrows indicate only GFP expression) (B) Quantification and statistical analysis of xenograft experiment of 105 fibroblasts (FB), RFP+, RFP-, RFP+/−, and IL-1β-BM MF after co-injected with 105 MKN45 on the one side but only tumor cells on the contra lateral side. IL-1β-BM MF were injected at a distant site and 106 MKN cells were injected into the contralateral flank. (*=p<0.05 compared to MKN alone, #=p<0.05 compared to RFP+ and RFP+/− cells, and $=p< 0.005 compared to RFP- and FB, (Dunnett, All data are represented as mean and measure points). (C) RFP+/− cells or IL-1β-BM-CAF were injected s.c. in a mouse with a tumor of 106 MKN cells growing on the left flank. IHC for αSMA (green) and endogeneous RFP show double staining (orange arrows) or only αSMA expression (white arrow) in the tumor. (See also Figure S6)
Figure 8
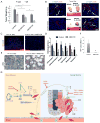
Figure 8. CXCR4/SDF1 inhibition reduced MF and MSC recruitment and tumor growth
(A) Effects of TGF-β or CXCR4 inhibition in xenografts of co-injection with IL-1β BM-MF and MKN45 cells on one flank and MKN45 on the other flank. Tumor size (middle) after 6 weeks of tumor growth in mice given the TGF-βR2 inhibitor (upper panel) or CXCR4 inhibitor (lower panel). Representative IHC of each tumor (right, left) with staining for endogeneous GFP and αSMA (orange arrows indicate double staining and white arrows indicate expression of only GFP). (B) Quantification and statistical analysis of xenograft experiment with mice co-injected with IL-1β BM-MF and MKN45 cells on one flank and MKN45 alone on the other flank. Tumor size in g after 6 weeks of tumor growth in mice given the TGF-βR2 inhibitor (SB-505124) or CXCR4 inhibitor (AMD3100) (*=p< 0.05 (Dunnett)) (C–F) Effect of CXCR4 inhibitor treatment on stomachs of 16 months old H. felis infected αSMA/RFP mice after 4 months of AMD3100 treatment: (C) Representative IHC of (left) untreated control and (right) AMD3100 treated mice and (D) histopathological scoring of the same experiment (*=p<0.05, (N=3)). (E) Representative pictures of (left) untreated control BM and (right) BM of AMD3100 treated mice with αSMA staining and (F) quantification of RFP+ cells in the BM by FACS (*=p<0.05, (N=3) . All data are represented as mean +/− SEM. (G) Schematic drawing that depicts interactions between the bone marrow niche (left) and the gastric cancer stroma (right). A significant portion of CAFs (red) originate from the bone marrow and are derived from MSCs (green). The normal bone marrow niche consists of self-renewing MSCs that give rise to MF that resemble CAFs and likely contribute to the normal stem cell niche in the bone marrow. In their niche, MSC express both Gremlin-1 and SDF-1. TGF-β can induce the differentiation of MSC into MFs through an SDF1α-dependent pathway that involves DNA hypomethylation. MF express BMP4, which seems to induce Gremlin-1 in MSCs; BMP4 and Wnt5a likely induce DKK1 or Shh in the normal, heterogeneous population of MSC. With cancer progression, the number of CAFs increases markedly in the bone marrow niche and blood. These bone marrow niche cells are expanded in a TGF-β dependent matter and recruited through CXCR4/SDF1α signaling together with Gremlin-1-expressing MSC to incipient tumors where they now appear as CAFs.

Similar articles

Cited by

References

    1. Allinen M, Beroukhim R, Cai L, Brennan C, Lahti-Domenici J, Huang H, Porter D, Hu M, Chin L, Richardson A, et al. Molecular characterization of the tumor microenvironment in breast cancer. Cancer Cell. 2004;6:17–32. - PubMed
    1. Azab AK, Runnels JM, Pitsillides C, Moreau AS, Azab F, Leleu X, Jia X, Wright R, Ospina B, Carlson AL, et al. CXCR4 inhibitor AMD3100 disrupts the interaction of multiple myeloma cells with the bone marrow microenvironment and enhances their sensitivity to therapy. Blood. 2009;113:4341–4351. - PMC - PubMed
    1. Brabletz S, Schmalhofer O, Brabletz T. Gastrointestinal stem cells in development and cancer. J Pathol. 2009;217:307–317. - PubMed
    1. Coussens LM, Werb Z. Inflammation and cancer. Nature. 2002;420:860–867. - PMC - PubMed
    1. Direkze NC, Forbes SJ, Brittan M, Hunt T, Jeffery R, Preston SL, Poulsom R, Hodivala-Dilke K, Alison MR, Wright NA. Multiple organ engraftment by bone-marrow-derived myofibroblasts and fibroblasts in bone-marrow-transplanted mice. Stem Cells. 2003;21:514–520. - PubMed

Publication types

MeSH terms

Associated data

  NODES
Project 1
twitter 2