Proteomic characterization of cellular and molecular processes that enable the Nanoarchaeum equitans--Ignicoccus hospitalis relationship
- PMID: 21826220
- PMCID: PMC3149612
- DOI: 10.1371/journal.pone.0022942
Proteomic characterization of cellular and molecular processes that enable the Nanoarchaeum equitans--Ignicoccus hospitalis relationship
Abstract
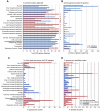
Nanoarchaeum equitans, the only cultured representative of the Nanoarchaeota, is dependent on direct physical contact with its host, the hyperthermophile Ignicoccus hospitalis. The molecular mechanisms that enable this relationship are unknown. Using whole-cell proteomics, differences in the relative abundance of >75% of predicted protein-coding genes from both Archaea were measured to identify the specific response of I. hospitalis to the presence of N. equitans on its surface. A purified N. equitans sample was also analyzed for evidence of interspecies protein transfer. The depth of cellular proteome coverage achieved here is amongst the highest reported for any organism. Based on changes in the proteome under the specific conditions of this study, I. hospitalis reacts to N. equitans by curtailing genetic information processing (replication, transcription) in lieu of intensifying its energetic, protein processing and cellular membrane functions. We found no evidence of significant Ignicoccus biosynthetic enzymes being transported to N. equitans. These results suggest that, under laboratory conditions, N. equitans diverts some of its host's metabolism and cell cycle control to compensate for its own metabolic shortcomings, thus appearing to be entirely dependent on small, transferable metabolites and energetic precursors from I. hospitalis.
Conflict of interest statement
Figures


Similar articles
-
Life on the edge: functional genomic response of Ignicoccus hospitalis to the presence of Nanoarchaeum equitans.ISME J. 2015 Jan;9(1):101-14. doi: 10.1038/ismej.2014.112. Epub 2014 Jul 11. ISME J. 2015. PMID: 25012904 Free PMC article.
-
Multi-omics analysis provides insight to the Ignicoccus hospitalis-Nanoarchaeum equitans association.Biochim Biophys Acta Gen Subj. 2017 Sep;1861(9):2218-2227. doi: 10.1016/j.bbagen.2017.06.001. Epub 2017 Jun 4. Biochim Biophys Acta Gen Subj. 2017. PMID: 28591626 Free PMC article.
-
A genomic analysis of the archaeal system Ignicoccus hospitalis-Nanoarchaeum equitans.Genome Biol. 2008;9(11):R158. doi: 10.1186/gb-2008-9-11-r158. Epub 2008 Nov 10. Genome Biol. 2008. PMID: 19000309 Free PMC article.
-
The unusual cell biology of the hyperthermophilic Crenarchaeon Ignicoccus hospitalis.Antonie Van Leeuwenhoek. 2012 Aug;102(2):203-19. doi: 10.1007/s10482-012-9748-5. Epub 2012 Jun 1. Antonie Van Leeuwenhoek. 2012. PMID: 22653377 Review.
-
Happy together: genomic insights into the unique Nanoarchaeum/Ignicoccus association.J Biol. 2009;8(1):7. doi: 10.1186/jbiol110. Epub 2009 Jan 23. J Biol. 2009. PMID: 19216728 Free PMC article. Review.
Cited by
-
Cell surface architecture of the cultivated DPANN archaeon Nanobdella aerobiophila.J Bacteriol. 2024 Feb 22;206(2):e0035123. doi: 10.1128/jb.00351-23. Epub 2024 Jan 30. J Bacteriol. 2024. PMID: 38289045 Free PMC article.
-
Genesis of ectosymbiotic features based on commensalistic syntrophy.Sci Rep. 2024 Jan 16;14(1):1366. doi: 10.1038/s41598-023-47211-8. Sci Rep. 2024. PMID: 38228651 Free PMC article.
-
Life Detection and Microbial Biomarker Profiling with Signs of Life Detector-Life Detector Chip During a Mars Drilling Simulation Campaign in the Hyperarid Core of the Atacama Desert.Astrobiology. 2023 Dec;23(12):1259-1283. doi: 10.1089/ast.2021.0174. Epub 2023 Nov 6. Astrobiology. 2023. PMID: 37930382 Free PMC article.
-
The monomeric archaeal primase from Nanoarchaeum equitans harbours the features of heterodimeric archaeoeukaryotic primases and primes sequence-specifically.Nucleic Acids Res. 2023 Jun 9;51(10):5087-5105. doi: 10.1093/nar/gkad261. Nucleic Acids Res. 2023. PMID: 37099378 Free PMC article.
-
Culture-based approaches to studying "microbial dark matter".Proc Natl Acad Sci U S A. 2023 Jan 10;120(2):e2219691120. doi: 10.1073/pnas.2219691120. Epub 2023 Jan 3. Proc Natl Acad Sci U S A. 2023. PMID: 36595687 Free PMC article. No abstract available.
References
-
- Huber H, Hohn MJ, Rachel R, Fuchs T, Wimmer VC, et al. A new phylum of Archaea represented by a nanosized hyperthermophilic symbiont. Nature. 2002;417:63–67. - PubMed
-
- Jahn U, Summons R, Sturt H, Grosjean E, Huber H. Composition of the lipids of Nanoarchaeum equitans and their origin from its host Ignicoccus sp. strain KIN4/I. Arch Microbiol. 2004;182:404–413. - PubMed
-
- Gstaiger M, Aebersold R. Applying mass spectrometry-based proteomics to genetics, genomics and network biology. Nat Rev Genet. 2009;10:617–627. - PubMed
Publication types
MeSH terms
Substances
LinkOut - more resources
Full Text Sources

