Antigen-specific IL-2 secretion correlates with NK cell responses after immunization of Tanzanian children with the RTS,S/AS01 malaria vaccine
- PMID: 22504653
- PMCID: PMC3378032
- DOI: 10.4049/jimmunol.1102710
Antigen-specific IL-2 secretion correlates with NK cell responses after immunization of Tanzanian children with the RTS,S/AS01 malaria vaccine
Abstract
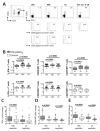
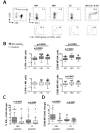
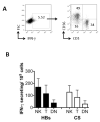
RTS,S/AS01, a vaccine _targeting pre-erythrocytic stages of Plasmodium falciparum, is undergoing clinical trials. We report an analysis of cellular immune response to component Ags of RTS,S-hepatitis B surface Ag (HBs) and P. falciparum circumsporozoite (CS) protein-among Tanzanian children in a phase IIb RTS,S/AS01(E) trial. RTS,S/AS01 (E) vaccinees make stronger T cell IFN-γ, CD69, and CD25 responses to HBs peptides than do controls, indicating that RTS,S boosts pre-existing HBs responses. T cell CD69 and CD25 responses to CS and CS-specific secreted IL-2 were augmented by RTS,S vaccination. Importantly, more than 50% of peptide-induced IFN-γ(+) lymphocytes were NK cells, and the magnitude of the NK cell CD69 response to HBs peptides correlated with secreted IL-2 concentration. CD69 and CD25 expression and IL-2 secretion may represent sensitive markers of RTS,S-induced, CS-specific T cells. The potential for T cell-derived IL-2 to augment NK cell activation in RTS,S-vaccinated individuals, and the relevance of this for protection, needs to be explored further.
Trial registration: ClinicalTrials.gov NCT00380393.
Figures


Similar articles
-
Circumsporozoite-specific T cell responses in children vaccinated with RTS,S/AS01E and protection against P falciparum clinical malaria.PLoS One. 2011;6(10):e25786. doi: 10.1371/journal.pone.0025786. Epub 2011 Oct 6. PLoS One. 2011. PMID: 21998698 Free PMC article. Clinical Trial.
-
Induction of Plasmodium falciparum-specific CD4+ T cells and memory B cells in Gabonese children vaccinated with RTS,S/AS01(E) and RTS,S/AS02(D).PLoS One. 2011 Apr 11;6(4):e18559. doi: 10.1371/journal.pone.0018559. PLoS One. 2011. PMID: 21494604 Free PMC article. Clinical Trial.
-
Immunogenicity of the RTS,S/AS01 malaria vaccine and implications for duration of vaccine efficacy: secondary analysis of data from a phase 3 randomised controlled trial.Lancet Infect Dis. 2015 Dec;15(12):1450-8. doi: 10.1016/S1473-3099(15)00239-X. Epub 2015 Sep 2. Lancet Infect Dis. 2015. PMID: 26342424 Free PMC article. Clinical Trial.
-
Characterization of T-cell immune responses in clinical trials of the candidate RTS,S malaria vaccine.Hum Vaccin Immunother. 2018 Jan 2;14(1):17-27. doi: 10.1080/21645515.2017.1381809. Epub 2017 Dec 1. Hum Vaccin Immunother. 2018. PMID: 28934066 Free PMC article. Review.
-
Clinical development of RTS,S/AS malaria vaccine: a systematic review of clinical Phase I-III trials.Future Microbiol. 2015;10(10):1553-78. doi: 10.2217/fmb.15.90. Epub 2015 Oct 6. Future Microbiol. 2015. PMID: 26437872 Review.
Cited by
-
A statistical interaction between circumsporozoite protein-specific T cell and antibody responses and risk of clinical malaria episodes following vaccination with RTS,S/AS01E.PLoS One. 2012;7(12):e52870. doi: 10.1371/journal.pone.0052870. Epub 2012 Dec 27. PLoS One. 2012. PMID: 23300801 Free PMC article.
-
Semaphorin 7A modulates cytokine-induced memory-like responses by human natural killer cells.Eur J Immunol. 2019 Aug;49(8):1153-1166. doi: 10.1002/eji.201847931. Epub 2019 May 2. Eur J Immunol. 2019. PMID: 31016720 Free PMC article.
-
Historical BCG vaccination combined with drug treatment enhances inhibition of mycobacterial growth ex vivo in human peripheral blood cells.Sci Rep. 2019 Mar 19;9(1):4842. doi: 10.1038/s41598-019-41008-4. Sci Rep. 2019. PMID: 30890730 Free PMC article.
-
The robust and modulated biomarker network elicited by the Plasmodium vivax infection is mainly mediated by the IL-6/IL-10 axis and is associated with the parasite load.J Immunol Res. 2014;2014:318250. doi: 10.1155/2014/318250. Epub 2014 Mar 18. J Immunol Res. 2014. PMID: 24741587 Free PMC article.
-
Immune responses to malaria pre-erythrocytic stages: Implications for vaccine development.Parasite Immunol. 2021 Feb;43(2):e12795. doi: 10.1111/pim.12795. Epub 2020 Oct 9. Parasite Immunol. 2021. PMID: 32981095 Free PMC article. Review.
References
-
- Ballou WR. The development of the RTS,S malaria vaccine candidate: challenges and lessons. Parasite Immunol. 2009;31:492–500. - PubMed
-
- Casares S, Brumeanu TD, Richie TL. The RTS,S malaria vaccine. Vaccine. 28:4880–4894. - PubMed
-
- Lusingu J, Olotu A, Leach A, Lievens M, Vekemans J, Olivier A, Benns S, Olomi R, Msham S, Lang T, Gould J, Hallez K, Guerra Y, Njuguna P, Awuondo KO, Malabeja A, Abdul O, Gesase S, Dekker D, Malle L, Ismael S, Mturi N, Drakeley CJ, Savarese B, Villafana T, Ballou WR, Cohen J, Riley EM, Lemnge MM, Marsh K, Bejon P, von Seidlein L. Safety of the malaria vaccine candidate, RTS,S/AS01E in 5 to 17 month old Kenyan and Tanzanian Children. PLoS One. 5:e14090. - PMC - PubMed
Publication types
MeSH terms
Substances
Associated data
Grants and funding
LinkOut - more resources
Full Text Sources
Other Literature Sources

