Greater whole-grain intake is associated with lower risk of type 2 diabetes, cardiovascular disease, and weight gain
- PMID: 22649266
- PMCID: PMC6498460
- DOI: 10.3945/jn.111.155325
Greater whole-grain intake is associated with lower risk of type 2 diabetes, cardiovascular disease, and weight gain
Erratum in
- J Nutr. 2013 Sep;143(9):1524
Abstract
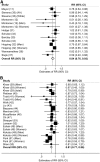
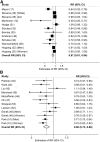
Whole-grain and high fiber intakes are routinely recommended for prevention of vascular diseases; however, there are no comprehensive and quantitative assessments of available data in humans. The aim of this study was to systematically examine longitudinal studies investigating whole-grain and fiber intake in relation to risk of type 2 diabetes (T2D), cardiovascular disease (CVD), weight gain, and metabolic risk factors. We identified 45 prospective cohort studies and 21 randomized-controlled trials (RCT) between 1966 and February 2012 by searching the Cumulative Index to Nursing and Allied Health Literature, Cochrane, Elsevier Medical Database, and PubMed. Study characteristics, whole-grain and dietary fiber intakes, and risk estimates were extracted using a standardized protocol. Using random effects models, we found that compared with never/rare consumers of whole grains, those consuming 48-80 g whole grain/d (3-5 serving/d) had an ~26% lower risk of T2D [RR = 0.74 (95% CI: 0.69, 0.80)], ~21% lower risk of CVD [RR = 0.79 (95% CI: 0.74, 0.85)], and consistently less weight gain during 8-13 y (1.27 vs 1.64 kg; P = 0.001). Among RCT, weighted mean differences in post-intervention circulating concentrations of fasting glucose and total and LDL-cholesterol comparing whole-grain intervention groups with controls indicated significantly lower concentrations after whole-grain interventions [differences in fasting glucose: -0.93 mmol/L (95% CI: -1.65, -0.21), total cholesterol: -0.83 mmol/L (-1.23, -0.42); and LDL-cholesterol: -0.82 mmol/L (-1.31, -0.33)]. [corrected] Findings from this meta-analysis provide evidence to support beneficial effects of whole-grain intake on vascular disease prevention. Potential mechanisms responsible for whole grains' effects on metabolic intermediates require further investigation in large intervention trials.
Figures


Comment in
-
Do whole grain cereals really reduce LDL-cholesterol by 0.72 mmol/L?J Nutr. 2013 Sep;143(9):1521-2. doi: 10.3945/jn.113.177139. J Nutr. 2013. PMID: 23964016 No abstract available.
-
Reply to Wolever.J Nutr. 2013 Sep;143(9):1522-3. doi: 10.3945/jn.113.179267. J Nutr. 2013. PMID: 24137670 No abstract available.
Similar articles
-
Whole-Grain Intake, Reflected by Dietary Records and Biomarkers, Is Inversely Associated with Circulating Insulin and Other Cardiometabolic Markers in 8- to 11-Year-Old Children.J Nutr. 2017 May;147(5):816-824. doi: 10.3945/jn.116.244624. Epub 2017 Mar 29. J Nutr. 2017. PMID: 28356426
-
Do whole grain cereals really reduce LDL-cholesterol by 0.72 mmol/L?J Nutr. 2013 Sep;143(9):1521-2. doi: 10.3945/jn.113.177139. J Nutr. 2013. PMID: 23964016 No abstract available.
-
The Effect of Replacing Refined Grains with Whole Grains on Cardiovascular Risk Factors: A Systematic Review and Meta-Analysis of Randomized Controlled Trials with GRADE Clinical Recommendation.J Acad Nutr Diet. 2020 Nov;120(11):1859-1883.e31. doi: 10.1016/j.jand.2020.06.021. Epub 2020 Sep 12. J Acad Nutr Diet. 2020. PMID: 32933853
-
Consumption of cereal fiber, mixtures of whole grains and bran, and whole grains and risk reduction in type 2 diabetes, obesity, and cardiovascular disease.Am J Clin Nutr. 2013 Aug;98(2):594-619. doi: 10.3945/ajcn.113.067629. Epub 2013 Jun 26. Am J Clin Nutr. 2013. PMID: 23803885 Review.
-
Whole-grain and blood lipid changes in apparently healthy adults: a systematic review and meta-analysis of randomized controlled studies.Am J Clin Nutr. 2015 Sep;102(3):556-72. doi: 10.3945/ajcn.115.109165. Epub 2015 Aug 12. Am J Clin Nutr. 2015. PMID: 26269373 Review.
Cited by
-
A Study of the Influence of Ion-Ozonized Water on the Properties of Pasta Dough Made from Wheat Flour and Pumpkin Powder.Foods. 2024 Oct 13;13(20):3253. doi: 10.3390/foods13203253. Foods. 2024. PMID: 39456314 Free PMC article.
-
Rice consumption and risk of cardiovascular disease: results from a pooled analysis of 3 U.S. cohorts.Am J Clin Nutr. 2015 Jan;101(1):164-72. doi: 10.3945/ajcn.114.087551. Epub 2014 Nov 12. Am J Clin Nutr. 2015. PMID: 25527760 Free PMC article.
-
Long-term effects of a food pattern on cardiovascular risk factors and age-related changes of muscular and cognitive function.Medicine (Baltimore). 2020 Sep 25;99(39):e22381. doi: 10.1097/MD.0000000000022381. Medicine (Baltimore). 2020. PMID: 32991458 Free PMC article.
-
Association between whole grain intake and all-cause mortality: a meta-analysis of cohort studies.Onco_target. 2016 Sep 20;7(38):61996-62005. doi: 10.18632/onco_target.11491. Onco_target. 2016. PMID: 27566558 Free PMC article.
-
Plasma alkylresorcinols, biomarkers of whole-grain intake, are not associated with progression of coronary artery atherosclerosis in postmenopausal women with coronary artery disease.Public Health Nutr. 2016 Feb;19(2):326-31. doi: 10.1017/S1368980015001123. Epub 2015 Apr 23. Public Health Nutr. 2016. PMID: 25903091 Free PMC article. Clinical Trial.
References
-
- WHO Diet, nutrition and the prevention of chronic diseases: report of a joint WHO/FAO expert consultation. Geneva: WHO Technical Report Series; 2002. p. 916.
-
- Dietary Guidelines for Americans 2010. Washington, DC: U.S. Government Printing; 2010.
-
- Bantle JP, Wylie-Rosett J, Albright AL, Apovian CM, Clark NG, Franz MJ, Hoogwerf BJ, Lichtenstein AH, Mayer-Davis E, Mooradian AD, et al. Nutrition recommendations and interventions for diabetes: a position statement of the American Diabetes Association. Diabetes Care. 2008;31Suppl 1:S61–78. - PubMed
-
- Mann JI, De Leeuw I, Hermansen K, Karamanos B, Karlstrom B, Katsilambros N, Riccardi G, Rivellese AA, Rizkalla S, Slama G, et al. Evidence-based nutritional approaches to the treatment and prevention of diabetes mellitus. Nutr Metab Cardiovasc Dis. 2004;14:373–94. - PubMed
-
- Bazzano LA, Song Y, Bubes V, Good CK, Manson JE, Liu S. Dietary intake of whole and refined grain breakfast cereals and weight gain in men. Obes Res. 2005;13:1952–60. - PubMed
Publication types
MeSH terms
Substances
Grants and funding
LinkOut - more resources
Full Text Sources
Medical

