. 2012 Dec 1;303(11):H1319-31.
doi: 10.1152/ajpheart.00160.2012. Epub 2012 Sep 28.

Sonic hedgehog promotes autophagy of vascular smooth muscle cells

Affiliations

Sonic hedgehog promotes autophagy of vascular smooth muscle cells

Haijie Li et al. Am J Physiol Heart Circ Physiol. .

Abstract

Sonic hedgehog (Shh) is a morphogen critically involved in development that is reexpressed in atherosclerotic lesions. It also stimulates proliferation of vascular smooth muscle cells (SMCs). Autophagy in vascular SMCs is known to promote SMC survival and increase plaque stability. The aim of this study was to investigate whether Shh induces autophagy of vascular SMCs. Our study showed that both Shh protein and microtubule-associated protein 1 light chain 3 (LC3)-II were increased in SMCs within neointimal lesions of mouse common carotid arteries. In cultured mouse aortic SMCs, recombinant mouse Shh stimulated LC3-II levels. Overexpression of wild-type mouse Shh through the tetracycline-regulated expression-inducible system in human aortic SMCs time-dependently increased the levels of LC3-II and also stimulated protein kinase B (AKT) phosphorylation. Pretreatment with AKT inhibitor IV (AKTI IV) inhibited AKT phosphorylation and the increase in LC3-II. Shh-induced autophagy was further confirmed by the formation of autophagosomes as detected by immunostaining and transmission electron microscopy, which was inhibited by AKTI IV. Shh further increased SMC LC3-II in the presence of bafilomycin A1, (2S,3S)-trans-epoxysuccinyl-L-leucylamido-3-methylbutane ethyl ester, and pepstatin A or siRNA for the autophagy-related gene 7 (ATG7). In addition, Shh induced SMC proliferation, which was inhibited not only by AKTI IV but also by cyclopamine, an inhibitor of Shh receptor. Inhibition of autophagy with 3-methyladenine (3-MA), bafilomycin A1, or ATG7 siRNA resulted in inhibition of cell proliferation. Treatment with 3-MA, AKTI IV, or cyclopamine inhibited neointima formation in mouse common carotid arteries. Taken together, our results have shown that Shh induces autophagy of vascular SMCs involving AKT activation, suggesting a role of autophagy in Shh-induced cellular responses.


Figures
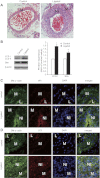
Fig. 1.
Fig. 1.
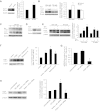
Expression of sonic hedgehog (Shh) correlates with autophagy in neointimal lesions of mouse common carotid arteries. Neointimal lesions were created by ligation of mouse common carotid arteries as described in the methods. A: representative micrographs of hematoxylin and eosin (H&E) staining of tissue sections from control (left) and ligated (right) arteries. B: representative Western blots (left) and quantitative data normalized to β-actin (right, *P < 0.05, n = 3) showed the expression levels of light chain 3 (LC3)-I (18 kDa), LC3-II (16 kDa), and Shh in the control and neointimal lesions. NI, neointima; L, lumen; M, media. C and D: tissue sections were stained for Shh (red, C), LC3 (red, D), and smooth muscle (SM) α-actin (green, C and D). The nuclei were counterstained with 4′,6-diamidino-2-phenylindole (DAPI, blue; C and D; original magnification, ×200).
Fig. 2.
Fig. 2.
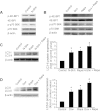
Exogenous Shh treatment or Shh induction stimulates LC3-II expression. A: representative Western blots (left) showing the levels of LC3-I and -II protein in mouse aortic smooth muscle cells (SMCs) treated with or without (control) the recombinant amino-terminal peptide of mouse sonic hedgehog (N-Shh). The quantitative results normalized to β-actin are shown in the bar graph (right, *P < 0.01, n = 3). B: Shh expression was induced by addition of doxycycline (Dox) through the inducible tetracycline-regulated expression (T-Rex) system, as described in methods. Human vascular SMCs harboring Shh-T-REx (Shh cells) or tetracycline-repression (TR) cells were treated with or without Dox for 24 h. Representative Western blots (left) showing the expression of Shh (detected with anti-c-myc antibody) and LC3-I and LC3-II. Densitometry of LC3-II Western blot signals was normalized to β-actin in the bar graph (right, *P < 0.05, n = 3). C: representative Western blots showing a time-dependent effect of LC3-I and LC3-II upregulation upon Shh induction. Shh cells were treated with Dox for 0, 12, 24, and 48 h. D: representative Western blots showing the levels of LC3-I and -II in the presence of Shh in response to cyclopamine (cyclo) treatment for 24 h. E: representative Western blots (left) showing the effects of (2S,3S)-trans-epoxysuccinyl-l-leucylamido-3-methylbutane ethyl ester (E64d, E) and pepstatin A (A) treatment (24 h) on the levels of LC3-I and -II in Shh and TR cells. The quantitative results normalized to β-actin are shown in the bar graph (right, *P < 0.01 vs. control and #P < 0.05 vs. E64d + pepstatin A treated, n = 3). F: representative Western blots (left) showing the effects of N-Shh and bafilomycin A1 treatment (24 h) on the levels of LC3-I and -II in TR cells. The quantitative results normalized to β-actin are shown in the bar graph (right, *P < 0.01 vs. control and #P < 0.05 vs. N-Shh treated, n = 3). G: real-time quantitative PCR showing the mRNA levels of autophagy-related gene 7 (ATG7) in TR cells transfected with negative-control (NC) small-interfering RNA (siRNA) or ATG7 siRNA for 48 h (*P < 0.05 vs. NC siRNA control, n = 3). H: representative Western blots (left) showing the effects of N-Shh treatment (24 h) on the levels of LC3-I and -II in TR cells transfected with NC siRNA or ATG7 siRNA for 48 h. The quantitative results normalized to β-actin are shown in the bar graph (right, *P < 0.01 vs. NC siRNA control, #P < 0.05 vs. N-Shh + NC siRNA control, n = 3).
Fig. 3.
Fig. 3.
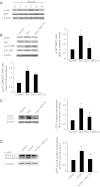
Shh-induced autophagy is independent of the mammalian _target of rapamycin (mTOR) pathway. A: Western blot detection of phospho (p)-4E-binding protein 1 (BP1), 4E-BP1, p-p70 S6K, and p70 S6K in mouse aortic SMCs treated with or without (control) N-Shh for 24 h. B: Western blot results of p-4E-BP1, 4E-BP1, p-p70 S6K, and p70 S6K in Shh cells treated with or without Dox and rapamycin (Rapa) for 24 h. C: Western blot detection (left) and quantified data (right) of LC3-I and LC3-II in mouse aortic SMCs treated without or with N-Shh in the presence or absence of rapamycin. *P < 0.01 vs. control and #P < 0.05 vs. Dox treated, n = 3. D: representative Western blot results (left) and summarized data (right) showing the effects of rapamycin on the expression of LC3-I and -II for 24 h in Shh cells. *P < 0.01. vs. control and #P < 0.05 vs. Dox treated, n = 3.
Fig. 4.
Fig. 4.
Inhibition of protein kinase B (AKT) inhibits Shh-induced LC3-II conversion. A: expression of p-AKT and AKT in Shh cells in the presence or absence of Shh induction (Dox) for different times (3, 5, 8, 12, and 24 h). B: effect of AKT inhibitor IV (AKTI IV, 10 μM) on the level of p-AKT and p-p70 S6K with or without Shh induction (Dox) for 8 h. *P < 0.01 vs. control and #P < 0.05 vs. Dox treated, n = 3. C: effect of AKTI IV on LC3-II conversion in cells with or without Shh induction (Dox). *P < 0.01 vs. control and #P < 0.05 vs. Dox treated, n = 3. D: effect of AKTI IV on green fluorescent protein (GFP)-LC3-II conversion in cells with and without Shh treatment. *P < 0.01 vs. control and #P < 0.05 vs. Shh treated, n = 3.
Fig. 5.
Fig. 5.
AKTI IV inhibits Shh-induced punctate LC3 and autophagosomes. A: representative images of fluorescence microscopy (original magnification, ×400) of SMCs harboring the Shh-T-REx system treated with or without AKTI IV in the presence or absence of Dox induction for 24 h. Cells were stained with LC3 antibody and Alexa Fluor 568-conjugated goat anti-rabbit IgG (red). The nuclei were counterstained with DAPI (blue). B: transmission electron microscopy images (original magnification, ×15,000) of Shh cells in the presence or absence of Shh induction (Dox) treated with or without rapamycin or AKTI IV for 24 h. N, nucleus. Arrows, autophagic vacuolization with content or myelin figures and single-membrane vacuoles; arrowheads, early double-membrane vacuoles.
Fig. 6.
Fig. 6.
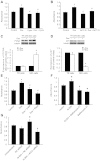
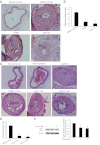
Proliferative effects of Shh induction on SMCs is inhibited by AKTI IV, cyclopamine, and 3-methyladenine (3-MA). A: Shh cells with or without Dox induction were treated with cyclopamine (Cyclo) for 24 h. Dimethyl sulfoxide (DMSO, control) was the vehicle control for cyclopamine. Cell numbers were determined using the water-soluble tetrazolium salt (Wst-1) assay (*P < 0.05 vs. control and #P < 0.05 vs. Dox treated, n = 4). B: Shh cells with or without Dox induction were incubated with AKTI IV for 24 h, followed by determination of cell numbers (*P < 0.05 vs. control and #P < 0.05 vs. Dox treated, n = 4). C and D: Western blots showing the effects of Shh induction on the expression of proliferating cell nuclear antigen (PCNA, C) and p27 (D) (top: representative Western blots). The expression of PCNA (C) or p27 (D) was normalized to α-tubulin (*P < 0.05 vs. without Dox treated, n = 5). E: Shh cells with or without Dox induction were treated with 3-MA or rapamycin for 24 h, followed by determination of cell numbers (*P < 0.05 vs. control and #P < 0.05 vs. Dox treated, n = 4). F: TR cells were treated with N-Shh, bafilomycin A1, or N-Shh and bafilomycin A1 for 24 h, followed by determination of cell numbers (*P < 0.05 vs. control and #P < 0.05 vs. N-Shh treated, n = 4). G: TR cells were transfected with NC siRNA or ATG7 siRNA in the presence of N-Shh for 24 h, followed by determination of cell numbers (*P < 0.05 vs. NC siRNA control and #P < 0.05 vs. N-Shh + NC siRNA, n = 4).
Fig. 7.
Fig. 7.
Neointima formation of mouse carotid arteries is inhibited by 3-MA, AKTI IV, and cyclopamine. Neointimal lesions were generated through ligation of mouse common carotid arteries as described in methods. 3-MA, AKTI IV, and cyclopamine were applied through PLF-127 gel. DMSO was the vehicle control for cyclopamine. A and B: representative micrographs of H&E staining (A) showing the effects of 3-MA and AKTI IV on the development of neointima (original magnification, ×200). The sizes of the lesions (B) were calculated as the ratio of the neointima area to that of the media (*P < 0.01 vs. DMSO control; n = 3). C and D: representative micrographs of H&E staining showing the effects of cyclopamine on the development of neointima (C; original magnification, ×200). The sizes of neointimal lesions were calculated as the ratio of the area of the neointima to that of the media (D; *P < 0.01 vs. DMSO control, n = 3). E: Western blot results (left) showing the effects of cyclopamine on LC3-II conversion in neointimal lesions. The intensity of bands was quantified and normalized to the DMSO control (right, *P < 0.01, n = 3).

Similar articles

Cited by

References

    1. Behrends C, Sowa ME, Gygi SP, Harper JW. Network organization of the human autophagy system. Nature 466: 68–76, 2010 - PMC - PubMed
    1. Bijlsma MF, Peppelenbosch MP, Spek CA. Hedgehog morphogen in cardiovascular disease. Circulation 114: 1985–1991, 2006 - PubMed
    1. Bijlsma MF, Spek CA. The Hedgehog morphogen in myocardial ischemia-reperfusion injury. Exp Biol Med (Maywood) 235: 447–454, 2010 - PubMed
    1. Byrd N, Becker S, Maye P, Narasimhaiah R, St-Jacques B, Zhang X, McMahon J, McMahon A, Grabel L. Hedgehog is required for murine yolk sac angiogenesis. Development 129: 361–372, 2002 - PubMed
    1. Byrd N, Grabel L. Hedgehog signaling in murine vasculogenesis and angiogenesis. Trends Cardiovasc Med 14: 308–313, 2004 - PubMed

Publication types

MeSH terms

  NODES
twitter 2