Regeneration-associated WNT signaling is activated in long-term reconstituting AC133bright acute myeloid leukemia cells
- PMID: 23308055
- PMCID: PMC3540948
- DOI: 10.1593/neo.121480
Regeneration-associated WNT signaling is activated in long-term reconstituting AC133bright acute myeloid leukemia cells
Abstract
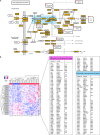
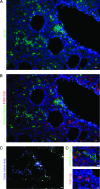
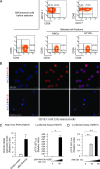
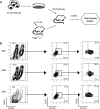
Acute myeloid leukemia (AML) is a genetically heterogeneous clonal disorder characterized by two molecularly distinct self-renewing leukemic stem cell (LSC) populations most closely related to normal progenitors and organized as a hierarchy. A requirement for WNT/β-catenin signaling in the pathogenesis of AML has recently been suggested by a mouse model. However, its relationship to a specific molecular function promoting retention of self-renewing leukemia-initiating cells (LICs) in human remains elusive. To identify transcriptional programs involved in the maintenance of a self-renewing state in LICs, we performed the expression profiling in normal (n = 10) and leukemic (n = 33) human long-term reconstituting AC133(+) cells, which represent an expanded cell population in most AML patients. This study reveals the ligand-dependent WNT pathway activation in AC133(bright) AML cells and shows a diffuse expression and release of WNT10B, a hematopoietic stem cell regenerative-associated molecule. The establishment of a primary AC133(+) AML cell culture (A46) demonstrated that leukemia cells synthesize and secrete WNT ligands, increasing the levels of dephosphorylated β-catenin in vivo. We tested the LSC functional activity in AC133(+) cells and found significant levels of engraftment upon transplantation of A46 cells into irradiated Rag2(-/-)γc(-/-) mice. Owing to the link between hematopoietic regeneration and developmental signaling, we transplanted A46 cells into developing zebrafish. This system revealed the formation of ectopic structures by activating dorsal organizer markers that act downstream of the WNT pathway. In conclusion, our findings suggest that AC133(bright) LSCs are promoted by misappropriating homeostatic WNT programs that control hematopoietic regeneration.
Figures


Similar articles
-
[TIM-3 signaling hijacks the canonical Wnt/β-catenin pathway to maintain cancer stemness in human acute myeloid leukemia].Rinsho Ketsueki. 2023;64(6):547-552. doi: 10.11406/rinketsu.64.547. Rinsho Ketsueki. 2023. PMID: 37407480 Japanese.
-
Differential niche and Wnt requirements during acute myeloid leukemia progression.Blood. 2011 Sep 8;118(10):2849-56. doi: 10.1182/blood-2011-03-345165. Epub 2011 Jul 15. Blood. 2011. PMID: 21765021 Free PMC article.
-
MiR-29b/Sp1/FUT4 axis modulates the malignancy of leukemia stem cells by regulating fucosylation via Wnt/β-catenin pathway in acute myeloid leukemia.J Exp Clin Cancer Res. 2019 May 16;38(1):200. doi: 10.1186/s13046-019-1179-y. J Exp Clin Cancer Res. 2019. PMID: 31097000 Free PMC article.
-
Deciphering the role of Wnt signaling in acute myeloid leukemia prognosis: how alterations in DNA methylation come into play in patients' prognosis.J Cancer Res Clin Oncol. 2020 Dec;146(12):3097-3109. doi: 10.1007/s00432-020-03407-3. Epub 2020 Sep 27. J Cancer Res Clin Oncol. 2020. PMID: 32980885 Review.
-
The role of WNT10B in physiology and disease.Acta Physiol (Oxf). 2012 Jan;204(1):34-51. doi: 10.1111/j.1748-1716.2011.02296.x. Epub 2011 May 7. Acta Physiol (Oxf). 2012. PMID: 21447090 Review.
Cited by
-
Aberrant Wnt Signaling in Leukemia.Cancers (Basel). 2016 Aug 26;8(9):78. doi: 10.3390/cancers8090078. Cancers (Basel). 2016. PMID: 27571104 Free PMC article. Review.
-
AML/Normal Progenitor Balance Instead of Total Tumor Load (MRD) Accounts for Prognostic Impact of Flowcytometric Residual Disease in AML.Cancers (Basel). 2021 May 26;13(11):2597. doi: 10.3390/cancers13112597. Cancers (Basel). 2021. PMID: 34073205 Free PMC article.
-
Cordycepin (3'dA) Induces Cell Death of AC133+ Leukemia Cells via Re-Expression of WIF1 and Down-Modulation of MYC.Cancers (Basel). 2023 Aug 2;15(15):3931. doi: 10.3390/cancers15153931. Cancers (Basel). 2023. PMID: 37568748 Free PMC article.
-
FZD6 triggers Wnt-signalling driven by WNT10BIVS1 expression and highlights new _targets in T-cell acute lymphoblastic leukemia.Hematol Oncol. 2021 Aug;39(3):364-379. doi: 10.1002/hon.2840. Epub 2021 Feb 16. Hematol Oncol. 2021. PMID: 33497493 Free PMC article.
-
Control of AC133/CD133 and impact on human hematopoietic progenitor cells through nucleolin.Leukemia. 2015 Nov;29(11):2208-20. doi: 10.1038/leu.2015.146. Epub 2015 Jun 19. Leukemia. 2015. PMID: 26183533
References
-
- Somervaille TC, Matheny CJ, Spencer GJ, Iwasaki M, Rinn JL, Witten DM, Chang HY, Shurtleff SA, Downing JR, Cleary ML. Hierarchical maintenance of MLL myeloid leukemia stem cells employs a transcriptional program shared with embryonic rather than adult stem cells. Cell Stem Cell. 2006;4:129–140. - PMC - PubMed
-
- Kirstetter P, Schuster MB, Bereshchenko O, Moore S, Dvinge H, Kurz E, Theilgaard-Mönch K, Månsson R, Pedersen TA, Pabst T, et al. Modeling of C/EBPα mutant acute myeloid leukemia reveals a common expression signature of committed myeloid leukemia-initiating cells. Cancer Cell. 2008;13:299–310. - PubMed
-
- Bereshchenko O, Mancini E, Moore S, Bilbao D, Månsson R, Luc S, Grover A, Jacobsen SE, Bryder D, Nerlov C. Hematopoietic stem cell expansion precedes the generation of committed myeloid leukemia-initiating cells in C/EBPα mutant AML. Cancer Cell. 2009;16:390–400. - PubMed
-
- Beachy PA, Karhadkar SS, Berman DM. Tissue repair and stem cell renewal in carcinogenesis. Nature. 2004;432:324–331. - PubMed
Publication types
MeSH terms
Substances
LinkOut - more resources
Full Text Sources
Medical
Molecular Biology Databases
Research Materials
