. 2013 Feb 19;110(8):E613-22.
doi: 10.1073/pnas.1216585110. Epub 2013 Jan 28.

Direct chemical evidence for sphingolipid domains in the plasma membranes of fibroblasts

Affiliations

Direct chemical evidence for sphingolipid domains in the plasma membranes of fibroblasts

Jessica F Frisz et al. Proc Natl Acad Sci U S A. .

Abstract

Sphingolipids play important roles in plasma membrane structure and cell signaling. However, their lateral distribution in the plasma membrane is poorly understood. Here we quantitatively analyzed the sphingolipid organization on the entire dorsal surface of intact cells by mapping the distribution of (15)N-enriched ions from metabolically labeled (15)N-sphingolipids in the plasma membrane, using high-resolution imaging mass spectrometry. Many types of control experiments (internal, positive, negative, and fixation temperature), along with parallel experiments involving the imaging of fluorescent sphingolipids--both in living cells and during fixation of living cells--exclude potential artifacts. Micrometer-scale sphingolipid patches consisting of numerous (15)N-sphingolipid microdomains with mean diameters of ∼200 nm are always present in the plasma membrane. Depletion of 30% of the cellular cholesterol did not eliminate the sphingolipid domains, but did reduce their abundance and long-range organization in the plasma membrane. In contrast, disruption of the cytoskeleton eliminated the sphingolipid domains. These results indicate that these sphingolipid assemblages are not lipid rafts and are instead a distinctly different type of sphingolipid-enriched plasma membrane domain that depends upon cortical actin.


Conflict of interest statement

The authors declare no conflict of interest.

Figures

Fig. 1.
Fig. 1.
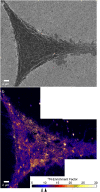
Secondary electron images of a Clone 15 fibroblast cell were acquired in parallel with the secondary ion signals, using NanoSIMS. Montage of 15 × 15-μm secondary electron images shows the morphology of a representative Clone 15 cell (cell 1).
Fig. 2.
Fig. 2.
Montage of 15N-enrichment images shows the 15N-sphingolipid distribution on the Clone 15 fibroblast cell (cell 1). The color scale represents the measured 12C15N/12C14N ratio divided by the natural abundance ratio, corresponding to the 15N-sphingolipid enrichment compared with an unlabeled cell (Fig. S2). The mean 15N-enrichment factors for domain-free regions and the entire cell are 7.8 (open arrowhead, SD = 2.1) and 9.5 (solid arrowhead, SD = 3.6), respectively. Lateral variations in the 15N-sphingolipid abundance are visible. Consistent with reports that fibroblasts deposit membrane fragments when migrating, 15N-sphingolipid–enriched debris is present on the substrate (28). The enlarged views of the secondary electron, 13C-enrichment, and 15N-enrichment images that were acquired at the outlined region on the cell (Inset) demonstrate that the 15N-sphingolipid domains do not coincide with cell topography or excess cellular lipids. The color scale for the 13C-enrichment image shown in the Inset is provided in Fig. 3.
Fig. 3.
Fig. 3.
13C-enrichment images of a Clone 15 fibroblast cell were acquired in parallel with the secondary electron (Fig. 1) and 15N-enrichment (Fig. 2) images. Montage of quantitative 13C-enrichment images reveals the distribution of all lipids in the plasma membrane of the Clone 15 cell (cell 1). The color scale shows the measured 13C1H/12C1H ratio divided by the natural abundance ratio, corresponding to the 13C-lipid enrichment compared with an unlabeled cell (Fig. S2). The mean 13C-enrichment for the entire surface of the cell was 16.3 (arrowhead, SD = 22.5). The elevated 13C-enrichment and the absence of statistically significant lateral variations in the 13C-enrichment on the cell verify the plasma membrane was intact. Speckling is due to low counts of the CH isotopologues.
Fig. 4.
Fig. 4.
TIRFM detection of BODIPY-sphingolipids in the plasma membrane of a Clone 15 cell at 37 °C. Stacks of 120 frames were acquired before and after fixation. Images were background subtracted and averaged through the stack to improve signal-to-noise ratio. (A) BODIPY-sphingolipid domains are visible in the plasma membrane of the living Clone 15 cell under physiological conditions. (B and C) Enlarged view of the region outlined in A shows the BODIPY-sphingolipid membrane domains (B) in the living cell and (C) following glutaraldehyde fixation. The sizes and distributions of the sphingolipid domains were unaltered by fixation. The high fluorescence of the cellular microextensions is an artifact of background correction and does not represent a local enrichment of sphingolipids; these microextensions have the same fluorescent intensities as the nondomain regions on the cell in the image without background correction (Fig. S8).
Fig. 5.
Fig. 5.
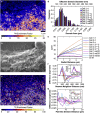
Sphingolipid-enriched domain size and spatial distribution. (A) White outlines show the perimeters of the 15N-sphingolipid domains (defined with a particle definition algorithm) in a portion of the 15N-enrichment image shown in Fig. 2. (B and C) The locations of the 15N-sphingolipid domains are outlined on the corresponding (B) secondary electron image (black) and (C) 13C-enrichment image (white). (D) The frequency distributions of sphingolipid domain sizes measured on cells fixed with glutaraldehyde solution at either RT or 37 °C or treated with mβCD show these treatments did not affect microdomain size. (E) Plot of Ripley’s K-test statistic, L(r) – r, as a function of distance. Data are normalized so the 99% CI (CI 99, dashed line) = 1. L(r) – r exceeds the CI 99 for all accessible distances >0.2 μm regardless of fixation temperature, signifying nonrandom microdomain clustering. mβCD treatment decreased domain clustering at distances >2 μm. (F) Plot of the difference between the frequency distribution of nearest neighbor (NN) domain distances measured for the observed (expt) domains (Inset) and a simulated (sim) random domain distribution on the cell body vs. distance. For all treatments, NN distances of ∼200 nm occurred more often than expected for a random distribution. (G) Difference in the pairwise domain distances (PD) measured for the observed and simulated randomly distributed domains is plotted as a function of distance. For both fixation temperatures, the higher occurrence of domain–domain distances between 5 and 10 μm than expected for randomly distributed domains (Inset) indicates the microdomain clusters were more abundant within 5- to 10-μm diameter patches on the cell body. Treatment with mβCD disrupted this long-range microdomain organization.
Fig. 6.
Fig. 6.
Secondary electron microscopy (SEM) and NanoSIMS 15N-enrichment images of a cholesterol-depleted Clone 15 fibroblast cell. (A) Low-voltage SEM image of a cholesterol-depleted Clone 15 cell shows slight changes in cell morphology following cholesterol depletion. This low-voltage SEM image has lower contrast than the secondary electron images that were acquired with NanoSIMS. (B) Montage of 15N-enrichment images of the same cholesterol-depleted Clone 15 cell reveals lateral variations in the 15N-enrichment and, thus, 15N-sphingolipid distribution. The color scale shows the 15N-sphingolipid enrichment compared with an unlabeled cell (Fig. S2). The mean 15N-enrichments for domain-free regions and the entire cell are 8.9 (open arrowhead, SD = 6.4), and 10.3 (solid arrowhead, SD = 8.7), respectively.
Fig. 7.
Fig. 7.
Secondary electron, 15N-enrichment, and 13C-enrichment images of a Clone 15 cell that was treated with lat-A for 30 min to disrupt the cytoskeleton. (A) Montage of secondary electron images acquired with NanoSIMS shows the extensive cell rounding that is characteristic of cytoskeleton disruption by lat-A treatment. (B) Montage of 15N-enrichment images of the same cell shows that micrometer-scale sphingolipid domains were not present on the cell surface after disruption of the cytoskeleton by treatment with lat-A. A few micrometer-scale 15N-sphingolipid aggregates are present on the cellular extensions adjacent to the rounded cell body (outlined with a dashed white line). (C) Montage of 13C-enrichment images shows the 13C-lipid distribution at the same location. The high 13C-enrichment on the substrate adjacent to the cell likely signifies the presence of membrane fragments.
Fig. 8.
Fig. 8.
(A and B) TIRFM detection of (A) BODIPY-sphingolipids (green) and (B) influenza hemagglutinin (red) in the plasma membrane of a living Clone 15 cell at 37 °C. (C) Overlay of the two images shows colocalization between the sphingolipids and hemagglutinin, denoted by the yellow color. Stacks of 120 frames were collected for each channel and averaged to increase signal-to-noise ratio. Final images are shown at 2× magnification without interpolation. The influenza hemagglutinin and sphingolipid domains were partially colocalized.
Fig. 9.
Fig. 9.
Metabolically labeled mouse fibroblast cell that does not express influenza hemagglutinin (NIH 3T3 cell line, the parent line from which Clone 15 was derived) was chemically fixed and imaged with SIMS. (A) Montage of secondary electron images of the NIH 3T3 fibroblast that were acquired with NanoSIMS. Cracks (arrows) occurred after cell dehydration. (B) Montage of 15N-enrichment images that were acquired in parallel to the secondary electron images shows plasma membrane domains enriched with 15N-sphingolipids.
Fig. P1.
Fig. P1.
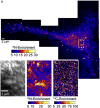
NanoSIMS images of the surface of a Clone 15 fibroblast cell. (A) The 15N-enrichment image of the entire dorsal surface of the cell shows 15N-sphingolipid-rich domains within the plasma membrane, evidenced by statistically significant local elevations in the 15N-enrichment. (B) The secondary electron image that corresponds to the region outlined in A shows the cell has normal morphology. (C) The 13C-enrichment image of the same region confirms the membrane was intact and the sample preparation and NanoSIMS imaging did not create artifactual lipid clustering. (D) Domains enriched with 15N-sphingolipids are visible in the enlarged 15N-enrichment image of the region outlined in A.

Similar articles

Cited by

References

    1. Radhakrishnan K, Halász A, Vlachos D, Edwards JS. Quantitative understanding of cell signaling: The importance of membrane organization. Curr Opin Biotechnol. 2010;21(5):677–682. - PMC - PubMed
    1. Karnovsky MJ, Kleinfeld AM, Hoover RL, Klausner RD. The concept of lipid domains in membranes. J Cell Biol. 1982;94(1):1–6. - PMC - PubMed
    1. Douglass AD, Vale RD. Single-molecule microscopy reveals plasma membrane microdomains created by protein-protein networks that exclude or trap signaling molecules in T cells. Cell. 2005;121(6):937–950. - PMC - PubMed
    1. Fujita A, Cheng J, Fujimoto T. Segregation of GM1 and GM3 clusters in the cell membrane depends on the intact actin cytoskeleton. Biochim Biophys Acta. 2009;1791(5):388–396. - PubMed
    1. Neumann AK, Itano MS, Jacobson K. Understanding lipid rafts and other related membrane domains. F1000 Biol Rep. 2010;2:31. - PMC - PubMed

Publication types

MeSH terms

LinkOut - more resources

  NODES
INTERN 1
Note 1
twitter 2
Verify 1