. 2013 Apr 15;23(4):450-63.
doi: 10.1016/j.ccr.2013.02.024. Epub 2013 Apr 4.

SIRT4 has tumor-suppressive activity and regulates the cellular metabolic response to DNA damage by inhibiting mitochondrial glutamine metabolism

Affiliations

SIRT4 has tumor-suppressive activity and regulates the cellular metabolic response to DNA damage by inhibiting mitochondrial glutamine metabolism

Seung Min Jeong et al. Cancer Cell. .

Abstract

DNA damage elicits a cellular signaling response that initiates cell cycle arrest and DNA repair. Here, we find that DNA damage triggers a critical block in glutamine metabolism, which is required for proper DNA damage responses. This block requires the mitochondrial SIRT4, which is induced by numerous genotoxic agents and represses the metabolism of glutamine into tricarboxylic acid cycle. SIRT4 loss leads to both increased glutamine-dependent proliferation and stress-induced genomic instability, resulting in tumorigenic phenotypes. Moreover, SIRT4 knockout mice spontaneously develop lung tumors. Our data uncover SIRT4 as an important component of the DNA damage response pathway that orchestrates a metabolic block in glutamine metabolism, cell cycle arrest, and tumor suppression.


Figures

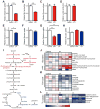
Figure 1
Figure 1. Glutamine metabolism is repressed by genotoxic stress
(A and B) Glutamine uptake (A) and ammonia production (B) in primary MEFs incubated without or with 14 μM CPT for 12 hr (n = 8–9). (C and D) Glucose uptake (C) and lactate production (D) in primary MEFs treated as indicated in Figure. 1A (n = 8–9). (E and F) Glutamine (E) and glucose (F) uptake in primary MEFs measured at 6 hr after 30 J/m2 UV treatment (n = 3). (G and H) Glutamine (G) and glucose (H) uptake in HepG2 cells treated without or with 14 μM CPT for 12 hr or at 6 hr after 30 J/m2 UV treatment (n = 3–6). (I) Schematic illustrating the metabolites that are increased (red) or decreased (blue) in transformed MEFs at 4 hr after 20 J/m2 UV exposure (n = 4; p < 0.05). Metabolites in parentheses were not measured. (J and K) Heat map comparing relative levels of intermediates in transformed MEFs measured at 4 hr after 20 J/m2 UV treatment when compared with an untreated control (n = 4 samples of each condition). Blue and red indicates down- or upregulation, respectively. (L) Heat map of 13C-glutamine contributed to labeled TCA cycle intermediates at 0, 2 and 4 hr after 20 J/m2 UV treatment (n = 4 samples of each condition). All changes are relative incorporation compared to each non-UV treated control after pulse of 13C-glutamine. Data are means ±SEM. *p < 0.05, **p < 0.005, ***p < 0.0001. See also Figure S1.
Figure 2
Figure 2. SIRT4 is induced by DNA damage stimuli
(A) Relative mRNA expression levels of indicated sirtuins in HEK293T cells treated with 14 μM CPT or 25 μM ETS for 15 hr were measured by qRT-PCR (n = 4). β-ACTIN was used as an endogenous control for qRT-PCR. (B) Relative Sirt4 mRNA levels in primary MEFs at 12 hr after treatment with CPT (14 μM), ETS (25 μM), IR (5 Gy) or UV (30 J/m2) were measured by qRT-PCR (n = 3–4). β-Actin was used as an endogenous control for qRT-PCR. (C) SIRT4 protein in whole cell lysates from HEK293T cells treated with CPT (14 μM) or ETS (25 μM) for 15 hr was detected by immunoblotting with anti-human SIRT4. β-ACTIN serves as a loading control. (D) SIRT4 protein in transformed WT and SIRT4 KO MEFs treated CPT (14 μM) for the indicated times. β-Actin serves as a loading control. Data are means ±SEM. *p < 0.05, **p < 0.005, ***p < 0.0001. All experiments were performed at least three times in duplicate. See also Figure S2.
Figure 3
Figure 3. SIRT4 represses mitochondrial glutamine metabolism in response to DNA damage
(A and B) Glutamine uptake in HepG2 cells stably expressing empty vector (Vector) or SIRT4 (SIRT4-OE) (A) or in immortalized WT and SIRT4 KO MEFs (B) (n = 3). (C) HEK293T Vector or SIRT4-OE cells deprived of glucose were given DM-KG (7 mM), pyruvate (1 mM), and/or oligomycin (5 μg/ml). Cell viability was measured via propidium iodide (PI) exclusion assay (n = 3). (D) Relative abundance of 13C-labeled TCA cycle intermediates (M+5 for α-ketoglutarate or M+4 for others) to the unlabeled from transformed WT and SIRT4 KO MEFs at the indicated times after pulse of 13C-glutamine (n = 4 samples of each condition). (E) Glutamine uptake in immortalized WT and SIRT4 KO MEFs treated with dimethyl sulfoxide (DMSO) or BPTES (10 μM) (n = 3–4). (F) GLS1 protein levels in HEK293T cells expressing GLS1-specific (shGLS#1 and 2) or control (shGFP) shRNAs. β-ACTIN serves as a loading control. (G) Glutamine uptake in control (shGFP) or GLS-knockdown (shGLS#1 and 2) cells after transfection with empty vector (Vector ) and SIRT4 (SIRT4-OE) (n = 3). (H) Relative glutamine uptake to each control in transformed WT and SIRT4 KO MEFs measured at the indicated times after 20 J/m2 UV exposure (n = 3). (I) Glutamine uptake in DMSO or BPTES (10 μM) treated immortalized MEFs after 20 J/m2 UV exposure (n = 3). (J) Heat map comparing relative levels of TCA cycle intermediates in transformed WT and SIRT4 KO MEFs at 4 hr after 20 J/m2 UV exposure (n = 4). Data are means ±SEM. n.s., not significant. *p < 0.05, **p < 0.005, ***p < 0.0001. See also Figure S3.
Figure 4
Figure 4. SIRT4 is involved in cellular DNA damage responses
(A) The measurement of BrdU+ cells and total DNA content in transformed WT and SIRT4 KO MEFs at the indicated times after 20 J/m2 UV exposure (n = 3). (B) The BrdU+ cell and total DNA content in transformed WT MEFs incubated with PBS or DMG (10 mM) after UV exposure (n = 3). (C and D) The number of γ-H2AX foci in immortalized WT and SIRT4 KO MEFs (C), or Vector and SIRT4-OE HeLa cells (D) was counted at the indicated times after IR treatment. (E and F) Survival of immortalized WT and SIRT4 KO MEFs (E), or Vector and SIRT4-OE HepG2 cells (F) treated with or without CPT (14 μM) or UV (30 J/m2) (n = 3–4). Cell viability was measured via PI exclusion assay. (G) Survival of HepG2 cells expressing control (shGFP) or GLS1-specific (shGLS#1 and 2) shRNAs were treated with DMSO or CPT (14 μM) for 24 hr (n = 3). Cell viability was measured via PI exclusion assay. (H and I) The percentage of chromosome number (H) and representative images of chromosome spread (I) of WT and SIRT4 KO MEFs at passage 2. Numbers of spreads counted were 64, 61, 142 and 104 for WT-1, WT-2, KO-1 and KO-2, respectively. Scale bar represents 10 μm. (J) Transformed WT and SIRT4 KO MEFs were treated with or without 20 J/m2 UV and the percentage of cells containing greater than 4n is analyzed by flow cytometry (n = 3). (K) Immunofluorescent staining of transformed WT and SIRT4 KO MEFs using nuclear (DAPI) and DSBs (γ-H2AX) markers (left). Scale bar represents 10 μm. The percentage of nuclei with the indicated number of γH2AX foci (right). WT MEFs (n = 119); KO MEFs (n = 71). Data are means ±SEM. *p < 0.05, **p < 0.005, ***p < 0.0001. See also Figure S4.
Figure 5
Figure 5. SIRT4 has tumor suppressive function
(A and B) Growth curves of WT and SIRT4 KO MEFs (n = 3) cultured in standard media (A) or media supplemented with BPTES (10 μM) (B). Data are means ±SD. (C and D) Growth curves of Vector and SIRT4-OE HeLa cells (n = 3) cultured in standard media (C) or media supplemented with BPTES (10 μM) (D). Data are means ±SD. (E) Focus formation assays with transformed WT and SIRT4 KO MEFs (left). Cells were cultured with normal medium or medium without glucose or glutamine for 10 days and stained with crystal violet. The number of colonies was counted (right) (n =3 samples of each condition). n.d., not determined. (F) Focus formation assays with transformed KO MEFs reconstituted with SIRT4 or a catalytic mutant of SIRT4 (n = 3). Cells were cultured for 8 days and stained with crystal violet. (G) Contact inhibited cell growth of transformed WT and SIRT4 KO MEFs cultured in the presence of DMSO or BPTES (10 μM) for 14 days (left). The number of colonies was counted (right). Data are means ±SEM. n.s., not significant. *p < 0.05, **p < 0.005. See also Figure S5.
Figure 6
Figure 6. SIRT4 is a mitochondrial tumor suppressor
(A) SIRT4 mRNA levels were determined using the Oncomine microarray database (http://www.oncomine.org) in normal versus lung, gastric, bladder, breast cancer and leukemia. LAD, lung adenocarcinoma; SCLC, small cell lung carcinoma; IBUC, infiltrating bladder urothelial carcinoma; IDBC, invasive ductal breast carcinoma; ILBC, invasive lobular breast carcinoma. The boxes represent the interquartile range; whiskers represent the 10th–90th percentile range; bars represent the median. (B) Kaplan-Meier curve comparing time to survival between lung adenocarcinomas with the lowest (< 25th percentile) versus highest (> 25th percentile) SIRT4 expression was determined using the Oncomine database. p = 0.0354, log-rank test. (C) Representative image of tumors resulting from xenograft with transformed WT and SIRT4 KO MEFs. Tumor volume and weight were measured (n = 8 tumors/genotypes). The boxes represent the interquartile range; whiskers represent the 10th–90th percentile range; bars represent the median. (D and E) Tumor-free curve (D) and analysis of tumor types (E) in WT and SIRT4 KO mice. p = 0.0035, log-rank test. (F) Histological sections of representative lung tumors from SIRT4 KO mice with H&E staining. Scale bar represents 20 μm. (G) Immunofluorescent staining of a representative lung adenocarcinoma from SIRT4 KO mice using nuclear (DAPI) and lung (TTF1) markers. Scale bar represents 20 μm. Data are means ±SEM. *p < 0.05, **p < 0.005, ***p < 0.0001. See also Figure S6.
Figure 7
Figure 7. SIRT4 inhibits mitochondria glutamine metabolism in vivo
(A) Relative Sirt4 mRNA levels in lung tissues for the indicated times after whole-body IR (10 Gy) were determined by qRT-PCR (n = 3). β-Actin was used as an endogenouse control for qRT-PCR. (B) GDH activity in lung tissue extracts from WT and SIRT4 KO mice (n = 5 animals/genotype). (C) GDH activity in lung tissue extracts from WT (left) and SIRT4 KO (right) mice at 12 hr after whole-body IR (10 Gy) (n = 5–6 mice of each condtion). (D and E) Glutamine (D) and glucose (E) uptake in SIRT4 KO lung tumor cells reconstituted with SIRT4 (n = 3). (F) Chromosomal abnormalities were examined in SIRT4 KO lung tumor cells reconstituted with SIRT4 after IR (5 Gy) treatment. (G) A proposed model illustrating the regulation of metabolic response to DNA damage by SIRT4. Data are means ±SEM. n.s., not significant. *p < 0.05, **p < 0.005. See also Figure S7.

Comment in

  • Sirt4: the glutamine gatekeeper.
    Fernandez-Marcos PJ, Serrano M. Fernandez-Marcos PJ, et al. Cancer Cell. 2013 Apr 15;23(4):427-8. doi: 10.1016/j.ccr.2013.04.003. Cancer Cell. 2013. PMID: 23597559 Free PMC article.
  • Metabolism: Metabolic block.
    Seton-Rogers S. Seton-Rogers S. Nat Rev Cancer. 2013 Jul;13(7):440-1. doi: 10.1038/nrc3547. Epub 2013 May 31. Nat Rev Cancer. 2013. PMID: 23722288 No abstract available.

Similar articles

Cited by

References

    1. Abbas T, Dutta A. p21 in cancer: intricate networks and multiple activities. Nat Rev Cancer. 2009;9:400–414. - PMC - PubMed
    1. Abraham RT. Cell cycle checkpoint signaling through the ATM and ATR kinases. Genes Dev. 2001;15:2177–2196. - PubMed
    1. Ahuja N, Schwer B, Carobbio S, Waltregny D, North BJ, Castronovo V, Maechler P, Verdin E. Regulation of insulin secretion by SIRT4, a mitochondrial ADP-ribosyltransferase. J Biol Chem. 2007;282:33583–33592. - PubMed
    1. Bester AC, Roniger M, Oren YS, Im MM, Sarni D, Chaoat M, Bensimon A, Zamir G, Shewach DS, Kerem B. Nucleotide deficiency promotes genomic instability in early stages of cancer development. Cell. 2011;145:435–446. - PMC - PubMed
    1. Blaveri E, Simko JP, Korkola JE, Brewer JL, Baehner F, Mehta K, Devries S, Koppie T, Pejavar S, Carroll P, et al. Bladder cancer outcome and subtype classification by gene expression. Clin Cancer Res. 2005;11:4044–4055. - PubMed

Publication types

MeSH terms

  NODES
twitter 2