. 2013:4:2575.
doi: 10.1038/ncomms3575.

Structural and functional characterization of two alpha-synuclein strains

Affiliations

Structural and functional characterization of two alpha-synuclein strains

Luc Bousset et al. Nat Commun. 2013.

Abstract

α-Synuclein aggregation is implicated in a variety of diseases including Parkinson's disease, dementia with Lewy bodies, pure autonomic failure and multiple system atrophy. The association of protein aggregates made of a single protein with a variety of clinical phenotypes has been explained for prion diseases by the existence of different strains that propagate through the infection pathway. Here we structurally and functionally characterize two polymorphs of α-synuclein. We present evidence that the two forms indeed fulfil the molecular criteria to be identified as two strains of α-synuclein. Specifically, we show that the two strains have different structures, levels of toxicity, and in vitro and in vivo seeding and propagation properties. Such strain differences may account for differences in disease progression in different individuals/cell types and/or types of synucleinopathies.


Figures

Figure 1
Figure 1. Structural characterization of the two α-syn polymorphs.
(a) Time courses of α-syn (100 μM) assembly in buffer A (50 mM Tris-HCl, pH 7.5, 150 mM KCl), red data points, and B (5 mM Tris-HCl, pH 7.5), blue data points, at 37 °C, monitored by measurement of scattered light at 440 nm. (b) Time courses of depolymerization at 4 °C of α-syn (100 μM monomer concentration) assemblies obtained in buffer A (high salt, red curve) and B (low salt, blue curve) assessed by quantifying α-syn within the pellet and supernatant fractions by SDS–PAGE, as described in the Methods. Data are mean±s.d. (n=4). (c,d) Negatively stained TEM of α-syn fibrils (c) and ribbons (d). The arrowheads point to twists; scale bars, 200 nm. (e,f), Proteinase K degradation patterns of α-syn (100 μM monomer concentration) fibrils (e) and ribbons (f), monitored over time on Coomassie stained SDS–PAGE (15%). Time (min) and molecular weight markers (kDa) are shown on the top and left of each gel, respectively. (g,h), X-ray diffraction pattern of partially aligned α-syn fibrils (g) and ribbons (h). α-syn fibrils X-ray scattering pattern is typical of amyloids showing a sharp anisotropic reflection at 4.7 Å along the meridian and another anisotropic reflection at 10 Å along the equator while that of α-syn ribbons resembles a powder/crystalline diffraction pattern with sharp meridional and equatorial reflections at 4.75 and 11 Å as well as long- and short-range reflections. (i) Radial averaging of the X-ray scattering patterns of α-syn fibrils (red curve) and ribbons (blue curve). (j) The conformational FILA antibody distinguishes equal amounts (0.4 μg) of α-syn fibrils (1) from α-syn ribbons (2) spotted on nitrocellulose membranes, whereas pan-α-syn antibodies (ASY1) do not. (k) Backbone Ψ angles as predicted by TALOS for α-syn fibrils (red) and ribbons (blue) based on sequential assignment. Suggested ß-sheet are indicated by arrows, with the lighter colours used for extensions if the glycines are assumed to be part of the ß-sheet or when uncertain TALOS β-sheet predictions (marked by crosses) are included into ß-sheets. Some residues in α-syn fibril show slight peak doubling. This is not considered here, as the resulting backbone angles are very similar.
Figure 2
Figure 2. Cross-seeding capacities of the two α-syn polymorphs.
Elongation of preformed α-syn fibrils (red data points) and ribbons (blue data points), 10 μM in (a) buffer A (50 mM Tris-HCl, pH 7.5, 150 mM KCl), (b) buffer B (5 mM Tris-HCl, pH 7.5), at 37 °C, in the presence of soluble α-syn (100 μM), monitored by measurement of scattered light at 440 nm. The control assembly reactions of soluble α-syn in the absence of preformed seeds (black data points) are also shown. When the seeded assembly reactions were centrifuged immediately after addition of the seeds (40,000 g for 30 min at 20 °C) and the supernatant and pellet fractions analysed by SDS–PAGE, the pellets contained the added seeds (fibrils or ribbons, 10% of the protein), whereas the supernatants contained the soluble α-syn (90% of the protein content of the solution). The amount of α-syn in the pellet and supernatant fractions at the indicated time (2, 24 and 150 h) in the absence (black letters) or the presence of α-syn fibrils (red letters) and ribbons (blue letters) seeds revealed by Coomassie blue stained SDS–PAGE are also shown. The inset in (a) corresponds to a blow-up on the initial stages of the assembly reactions. Electron micrographs and SDS–PAGE proteinase K degradation patterns of α-syn assemblies generated upon addition of preformed α-syn fibrils and ribbons are shown. The time (in min) and molecular weight markers (in kDa) are shown on the top and left of each Coomassie blue stained SDS–PAGE. The scale bars in the electron micrographs correspond to 200 nm.
Figure 3
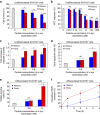
Figure 3. Toxicity of the two α-syn polymorphs.
Viability of undifferentiated SH-SY5Y cells treated for 24 h with increasing particle concentrations of α-syn fibrils (red bars) and ribbons (blue bars), measured by (a) cell survival counting and (b) MTT assay. Control cells treated with assembly buffer (grey bars) are shown. Data for a and b are mean±s.e. (n=6 independent measurements) expressed as percentages relative to controls. Ribbons versus fibrils, *P<0.05; **P<0.01; ***P<0.001 (two-sample, two-tailed independent Student’s t-test). (c) Caspase-3 activation in SH-SY5Y cells treated for 24 h with increasing particle concentrations of α-syn fibrils (red bars) and ribbons (blue bars). Data are shown as fold increase relative to the caspase-3 activity measured in control cells treated with assembly buffer (grey bar). Data are mean±s.e. (n=3 independent measurements). Ribbons versus fibrils, *P<0.05 (two-sample, two-tailed independent Student’s t-test). Increase in annexin V-PE labelling, (d) and DNA fragmentation, (e) upon treatment of differentiated SH-SY5Y cells with increasing particle concentrations of α-syn fibrils (red bars) and ribbons (blue bars) for 48 h. Control differentiated cells treated with buffer are also shown (grey bars). Annexin V-PE labelling data are percentages of annexin V-PE-positive/7-AAD-negative cells (early apoptotic cells) obtained from three independent experiments. Error bars are denoted as s.e. Ribbons versus fibrils, *P<0.05 (two-sample, two-tailed independent Student’s t-test). In the DNA fragmentation measurements, data are percentages of TUNEL-positive cells obtained from three independent experiments. Error bars are denoted as s.e. Ribbons versus fibrils, *P<0.05 (two-sample, two-tailed independent Student’s t-test) with control cells treated with assembly buffer. (f) Time course of intracellular ROS levels increase in differentiated SH-SY5Y cells treated with α-syn fibrils (red curve) and ribbons (blue curve), 0.2 nM. Cells were loaded with CellROX Orange Reagent and imaged by epifluorescence microscopy (see also Supplementary Fig. S8). Data are shown as percentage increase relative to the fluorescence values measured at time 0 (control untreated cells). Data are mean±s.e. (n=3 independent measurements). Ribbons versus fibrils, *P<0.05 (two-sample, two-tailed independent Student’s t-test).
Figure 4
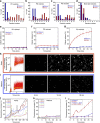
Figure 4. Differential interaction of the two α-syn polymorphs with synthetic and cell membranes.
Binding of 8 nM α-syn fibrils (red bars) and ribbons (blue bars) to (a) DOPC, (b) DOPS, (c) DOPG and (d) lipid extracts from brain unilamellar vesicles (6.25 mM lipids) measured by flotation. Membrane-bound α-syn assemblies were separated from free α-syn assemblies by density gradient ultracentrifugation. Data represent the distribution of α-syn fibrils (red bars) and ribbons (blue bars) in the different fractions of the density gradient, quantified by SDS–PAGE. Increasing fraction numbers on the x axes correspond to increasing densities. Calcein release from (e) DOPC, (f) DOPS and (g) DOPG unilamellar vesicles induced by 0.7 nM α-syn fibrils (red bars) and ribbons (blue bars). The α-syn assemblies were added to calcein-loaded vesicles and the fluorescence measured for 30 min. The data are obtained by subtracting the percentage of spontaneous calcein release measured in control vesicles treated with identical volumes of assembly buffer. Data are denoted as mean±s.e. (n=3 independent measurements). Time-dependent α-syn fibrils, (h), and ribbons, (i), binding to cells and increase in intracellular Ca2+ levels. Binding of 0.1 nM Alexa Fluor 488-labelled α-syn polymorphs to SH-SY5Y cells (left panels) was assessed by flow cytometry. The measurement dead time is 20 s. Cells loaded with Fluo-4-AM were imaged by epifluorescence microscopy after exposure to the two α-syn polymorphs to assess alterations in intracellular free Ca2+ levels. Scale bars, 30 μm. Quantification of the intracellular free Ca2+ increase measured over time for all the duration of the experiment in six representative cells exposed to α-syn fibrils (j) or ribbons (k), expressed as a fraction of the fluorescence recorded upon addition of ionomycin (10 μM) to the cells. (l) Kinetics of the intracellular free Ca2+ variation induced by α-syn fibrils (red curves) or ribbons (blue curves) in the absence (solid lines) or the presence of 5 mM EGTA (dashed lines). Data are mean±s.e. of the fluorescence measured in 50 different cellular areas of 20 μm2 each.
Figure 5
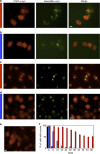
Figure 5. Differential seeding properties of the two α-syn polymorphs.
The diffuse distribution of ChFP-α-syn fluorescence in Neuro 2a cells (a) was converted to a punctate pattern within 4 h upon exposure of the cells to Alexa Fluor 488-labelled α-syn fibrils (0.01 nM). (b) No such redistribution was observed within the same time frame upon treatment of the cells with α-syn ribbons at a 10 fold higher concentration (0.1 nM). (d) The first ChFP-α-syn puncta were apparent in cells exposed for 18 h to α-syn ribbons (0.1 nM) (c) a time at which ChFP-α-syn was almost entirely recruited into puncta in cells exposed to α-syn fibrils (0.01 nM). (e) control cells unexposed to α-syn fibrils or ribbons. The merged images (right column) show that ChFP-α-syn puncta colocalize extensively with the exogenous Alexa Fluor 488-labelled α-syn polymorphs. Scale bar, 10 μm. (f) Neuro 2a cells exposed 48 h to α-syn fibrils or ribbons (0.1 nM) were passaged 2–3 times a week. The generation time of N2A cells under our experimental conditions was 14–16 h. The presence of internalized aggregates (green fluorescence) and induced puncta (red fluorescence) was scored in a blind manner by two scientists. The time courses of exogenous α-syn fibrils or ribbons (in black) and puncta induced by ribbons (blue) or fibrils (red) disappearance are shown. Data are mean±s.d. (n=3 independent measurements).
Figure 6
Figure 6. The two α-syn polymorphs imprint their intrinsic architecture to endogenous α-syn upon its recruitment.
Western blot analysis of the degradation profiles of the reporter ChFP-tagged α-syn in Neuro 2A cell lysate (corresponding to a cell density of 4 × 10⁶ cell per ml) upon exposure of the cells to exogenous α-syn fibrils or ribbons (2 μM monomeric concentration, for example, particle concentration of 0.25 and 2.2 nM for fibrils and ribbons, respectively) in the presence of the indicated concentrations of proteinase K (μg ml−1). The samples were analysed on 15% SDS–PAGE. The degradation profile of ChFP-tagged α-syn puncta seeded by α-syn fibrils (a) differs very significantly from that of ChFP-tagged α-syn puncta seeded by α-syn ribbons (b). Both patterns differ from that of ChFP-tagged α-syn from untreated Neuro 2A cells (c). The immunoreactivity of HSPA8 was used as a loading control (d). The molecular mass markers (in kilodaltons) are indicated.

Similar articles

Cited by

References

    1. Ross C. A. & Poirier M. A. Protein aggregation and neurodegenerative disease. Nat. Med. 10 Suppl, S10-7 (2004). - PubMed
    1. Goedert M. Alpha-synuclein and neurodegenerative diseases. Nat. Rev. Neurosci. 2, 492–501 (2001). - PubMed
    1. Spillantini M. G., Crowther R. A., Jakes R., Hasegawa M. & Goedert M. alpha-Synuclein in filamentous inclusions of Lewy bodies from Parkinson’s disease and dementia with lewy bodies. Proc. Natl Acad. Sci. USA 95, 6469–6473 (1998). - PMC - PubMed
    1. Lee H. J., Choi C. & Lee S. J. Membrane-bound alpha-synuclein has a high aggregation propensity and the ability to seed the aggregation of the cytosolic form. J. Biol. Chem. 277, 671–678 (2002). - PubMed
    1. Jensen P. H., Nielsen M. S., Jakes R., Dotti C. G. & Goedert M. Binding of alpha-synuclein to brain vesicles is abolished by familial Parkinson’s disease mutation. J. Biol. Chem. 273, 26292–26294 (1998). - PubMed

Publication types

MeSH terms

  NODES
Association 1
INTERN 1
Note 3
twitter 2