. 2014 Aug 19:3:e03083.
doi: 10.7554/eLife.03083.

The master cell cycle regulator APC-Cdc20 regulates ciliary length and disassembly of the primary cilium

Affiliations

The master cell cycle regulator APC-Cdc20 regulates ciliary length and disassembly of the primary cilium

Weiping Wang et al. Elife. .

Abstract

The primary cilium has an important role in signaling; defects in structure are associated with a variety of human diseases. Much of the most basic biology of this organelle is poorly understood, even basic mechanisms, such as control of growth and resorption. We show that the activity of the anaphase-promoting complex (APC), an E3 that regulates the onset of anaphase, destabilizes axonemal microtubules in the primary cilium. Furthermore, the metaphase APC co-activator, Cdc20, is specifically recruited to the basal body of primary cilia. Inhibition of APC-Cdc20 activity increases the ciliary length, while overexpression of Cdc20 suppresses cilium formation. APC-Cdc20 activity is required for the timely resorption of the cilium after serum stimulation. In addition, APC regulates the stability of axonemal microtubules through _targeting Nek1, the ciliary kinase, for proteolysis. These data demonstrate a novel function of APC beyond cell cycle control and implicate critical role of ubiquitin-mediated proteolysis in ciliary disassembly.

Keywords: cell cycle; primary cilum; retinal cell culture; ubiquitin.


Conflict of interest statement

The authors declare that no competing interests exist.

Figures
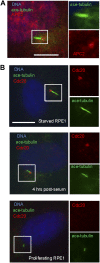
Figure 1.
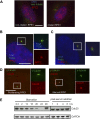
Figure 1.. APC-Cdc20 is localized to the basal body of the primary cilium.
(A) Subconfluent hTERT-RPE1 cells were serum starved for 48 hr, fixed, and stained for APC subunit 2 (APC2, red), acetylated tubulin (green) and DNA (blue). (B) Proliferating interphase RPE1 cells, serum starved cells, and quiescent cells after serum stimulation were fixed and stained for Cdc20 (red), acetylated tubulin (green), and DNA (blue). Boxes in main images indicate structures shown at higher magnification to right. The scale bars in this figure represent 10 μm. DOI: http://dx.doi.org/10.7554/eLife.03083.003
Figure 1—figure supplement 1.
Figure 1—figure supplement 1.. Degradation of securin in RPE1 cell extracts.
Cytosolic cell extracts were made from unsynchronized proliferating, serum-starved RPE1 cells respectively. Degradation of securin in these cell extracts at indicated time points was analyzed by western blot. TAME was added to test the dependence of the degradation on APC activity. Cell extract immunodepleted of Cdc20 was used for degradation assay as comparison. DOI: http://dx.doi.org/10.7554/eLife.03083.004
Figure 1—figure supplement 2.
Figure 1—figure supplement 2.. Localization of APC-Cdc20 to the basal body of primary cilia.
(A) Non-ciliated RPE1 cells (left) and ciliated cells (right) after serum starvation were stained for APC2 (red), acetylated tubulin (green), and DNA (blue). (B)Subconfluent hTERT-RPE1 cells were serum starved for 48 hr, fixed, and stained for APC subunit2 (APC2, red) and dynactin subunit P150 (green), and DNA (blue). (C) Starved RPE1 cells were fixed and stained for centrin 1 (red), dynactin subunit P150 (green), and DNA (blue). (D) Proliferating interphase cells and serum-starved cells were stained for Cdc20 (red) and γ-tubulin (green). The scale bars in this figure represent 10 μm. (E) RPE1 cells were collected at indicated time points during starvation and post serum stimulation and subjected to western blot for Cdc20 and GAPDH respectively. DOI: http://dx.doi.org/10.7554/eLife.03083.005
Figure 1—figure supplement 3.
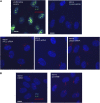
Figure 1—figure supplement 3.. Cdh1 is not localized to the basal body of primary cilia.
Starved RPE1 cells were fixed and stained for acetylated tubulin (green), DNA (blue), and Cdh1 (red). For Immunostaining of endogenous Cdh1, three different antibodies against Cdh1 were used as depicted. DOI: http://dx.doi.org/10.7554/eLife.03083.006
Figure 2.
Figure 2.. APC-Cdc20 negatively regulates the length of primary cilia.
(A and D) RPE1 cells were treated with control siRNA or siRNA _targeting APC2 or Cdc20 respectively, serum starved for 48 hr, and stained for acetylated tubulin (green) and DNA (blue). The scale bar represents 10 μm. (B and E) Western blot showed knockdown efficiency of siRNA treatment against Cdc20 and APc2. (C and F) Ciliary length was measured from ciliated cells based on acetylated-tubulin staining (n > 30). Data are means ±S.D. p <0.005. (G) RPE1 cells were transiently transfected with vectors expressing GFP (green) or Cdc20-GFP (green) respectively, serum starved for 48 hr, and were stained for acetylated tubulin (red) and DNA (blue). The scale bar represents 5 μm. (H) Percentage of ciliated cells was obtained from five independent experiments. An average of 100 cells was counted in each of the experiments. Data are means ±S.D. DOI: http://dx.doi.org/10.7554/eLife.03083.007
Figure 2—figure supplement 1.
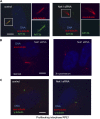
Figure 2—figure supplement 1.. The cells with longer cilia after inhibition of APC-Cdc20 are still in the quiescent stage.
(A) Proliferating PRE1 cells, starved cells transfected with siRNA against APC2, Cdc20, or Ube2S were fixed and stained for ace-tubulin (red), DNA (blue), and Ki-67 (green, the proliferation marker). (B) RPE1 cells were serum-starved for 60 hr and further starved for 3 hr in the presence of DMSO or 20 μM proTAME before staining for acetylated-tubulin (red), Ki-67 (green), and DNA (blue). The scale bars represent 10 μm. DOI: http://dx.doi.org/10.7554/eLife.03083.008
Figure 2—figure supplement 2.
Figure 2—figure supplement 2.. The effects of deregulation of APC co-activators on ciliogenesis.
(A) RPE1 cells were treated with control siRNA or siRNA-_targeting Cdh1 respectively, serum starved for 48 hr. Samples were collected for western blot for Cdh1 and GAPDH. Ciliary length was measured from ciliated cells based on acetylated-tubulin staining (n > 30). Data are means ±S.D. (B) RPE1 cells were transiently transfected with control vector or vector expressing Cdc20-GFP (green), serum starved for 48 hr, and stained for Arl13b (red) and DNA (blue). The scale bar represents 5 μm. Percentage of ciliated cells was calculated in control and Cdc20-GFP transfected cells. DOI: http://dx.doi.org/10.7554/eLife.03083.009
Figure 3.
Figure 3.. Treatment of ciliated cells with proTAME increased the ciliary length.
RPE1 cells were serum-starved for 60 hr and further starved for 3 hr in the presence of DMSO or 20 μM proTAME before staining for acetylated-tubulin (green) and DNA (blue). Ciliary length was measured from ciliated cells based on acetylated-tubulin staining (n > 30). Data are means ±S.D. p <0.001. The scale bar: 10 μm. DOI: http://dx.doi.org/10.7554/eLife.03083.010
Figure 4.
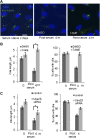
Figure 4.. Inhibition of APC activity prevented proper ciliary resorption post serum stimulation.
(A) Quiescent ciliated RPE1 cells were treated with serum containing either DMSO or 20 μM proTAME for 4 hr, fixed and stained for acetylated tubulin (green) and DNA (blue). Scale bar: 10 μm. (B) Quantitation of ciliary length and ciliation of DMSO or proTAME treated cells after serum stimulation. Ciliary length was measured from ciliated cells (n > 30) (*p <0.001); the percentage of ciliated cells was obtained from five independent experiments. Data are means ±S.D. (C) Cells were treated with control siRNA or Ube2S _targeting siRNA and were serum starved for 2 days in the presence of siRNA. Cilia were quantitated after release of cells from starvation for 4 hr. Ciliary length was measured from ciliated cells (n > 30) (*p <0.001); the percentage of ciliated cells was obtained from five independent experiments. Data are means ±S.D. DOI: http://dx.doi.org/10.7554/eLife.03083.011
Figure 4—figure supplement 1.
Figure 4—figure supplement 1.. Suppression of endogenous Cdc20 or APC2 by siRNA delayed cilium resorption.
Cells were transfected with control siRNA or Cdc20/APC2 _targeting siRNA and serum starved for 2 days in the presence of siRNA. 4 hr after serum stimulation, these cells were fixed and stained for acetylated tubulin (red), γ-tubulin (green), and DNA (blue). Scale bar = 10 μm. DOI: http://dx.doi.org/10.7554/eLife.03083.012
Figure 4—figure supplement 2.
Figure 4—figure supplement 2.. Inhibition of APC activity prevented cilia resorption caused by Calcium influx.
(A and B) Starved RPE1 cells were treated with DMSO, 1 μg/ml calcium ionophore (ion), or 1 μg/ml calcium ionophore +20 μM proTAME without serum for 3 hr. Cilia were visualized by acetylated tubulin staining (green) and DAPI staining of DNA (blue). Scale bar: 10 μm. Ciliary length was measured from ciliated cells (n > 30). (C) RPE1 cells were transfected with control siRNA or Ube2S _targeting siRNA, serum starved for 2 days, treated with 1 μg/ml calcium ionophore for 3 hr. Ciliary length was measured from ciliated cells (n > 30). Data are means ±S.D. DOI: http://dx.doi.org/10.7554/eLife.03083.013
Figure 4—figure supplement 3.
Figure 4—figure supplement 3.. RNAi suppression of endogenous Ube2S increased the ciliary length.
(A) siRNA-transfected cells were subjected to western blot for Ube2S. (B) siRNA-transfected starved cells were stained for acetylated tubulin (green) and DNA (blue). DOI: http://dx.doi.org/10.7554/eLife.03083.014
Figure 5.
Figure 5.. Nek1 is the substrate of APC-Cdc20 for the regulation of the structure of primary cilia.
(A) RPE1 cells were treated with control siRNA or Nek1 _targeting siRNA, serum starved for 48 hr, and stained for acetylated tubulin (red), γ-tubulin (green) and DNA (blue). Scale bar represents 5 μm. (B) siRNA-treated cells were subjected to Western blot for endogenous Nek1 and GAPDH. (C) Cells were transfected with control siRNA, Nek1 siRNA, or Nek1 siRNA together with Cdc20 siRNA respectively, serum starved for 2 days, and stained for acetylated tubulin. The percentage of cells with normal cilia or branched abnormal cilia was calculated from three independent experiments. Data are means ±S.D. (D) Western blot showed the decrease of Nek1 protein levels after serum stimulation. (E) Degradation of 35S-labelled Nek1 was examined in cell extracts prepared from HeLa S3 cells. Emi1 was added to test if the degradation was dependent on APC activity. The data were analyzed by autoradiography. (F) HA-tagged Nek1 was expressed and labeled with 35S in reticulocyte lysate. 35S-labelled Nek1 was purified through HA tag and subjected to in vitro ubiquitylation catalyzed by purified APC. (G) RPE1 cells were transfected with plasmid expressing HA-Nek1 and/or Myc-Cdc20, starved for 2 days and subjected to western blot for Myc tag, HA tag, and GAPDH. DOI: http://dx.doi.org/10.7554/eLife.03083.015
Figure 5—figure supplement 1.
Figure 5—figure supplement 1.. Test of ciliary proteins as APC substrates.
(A) RPE1 cells were starved for 48 hr, samples were collected at indicated time point after serum addition, and were subjected to western blot for Aurora-A and GAPDH. (B) RPE1 cells were transfected with control siRNA or siRNA against Cdc20, samples were collected after serum starved for 48 hr or 1 hr post serum addition and subjected for western blot for Aurora-A, Cdc20, and GAPDH. (C) 35S-labelled dishevelled protein (DVL) and securin were incubated in the HeLa S3 cell extracts. Samples were collected at indicated times and analyzed by autoradiography. Emi1 was added in the reaction to test whether the degradation was APC dependent. (D) 35S-labelled dishevelled and securin were subjected to in vitro ubiquitylation assay catalyzed by purified APC, recombinant Cdh1 and UBCH10. DOI: http://dx.doi.org/10.7554/eLife.03083.016
Figure 5—figure supplement 2.
Figure 5—figure supplement 2.. Depletion of Nek1 caused specific microtubule defects in primary cilia.
(A) RPE1 cells were transfected with control siRNA and Nek1 _targeting siRNA respectively, serum starved for 2 days, and stained for acetylated tubulin (red), Arl13b (green), and DNA (blue). (B) RPE1 cells transfected with Nek1 siRNA were starved for 2 days, fixed at 0 and 3 hr post serum addition, and stained for DNA (blue) and acetylated tubulin (red). (C) Proliferating RPE1 cells were transfected with siRNA in the presence of serum and stained for acetylated tubulin (red), γ-tubulin (green), and DNA (blue). Scale bars represent 5 μm. DOI: http://dx.doi.org/10.7554/eLife.03083.017

Similar articles

Cited by

References

    1. Avasthi P, Marshall WF. 2011. Stages of ciliogenesis and regulation of ciliary length. Differentiation 83:S30–S42. doi: 10.1016/j.diff.2011.11.015 - DOI - PMC - PubMed
    1. Besschetnova TY, Kolpakova-Hart E, Guan Y, Zhou J, Olsen BR, Shah JV. 2010. Identification of signaling pathways regulating primary cilium length and flow-mediated adaptation. Current Biology 20:182–187. doi: 10.1016/j.cub.2009.11.072 - DOI - PMC - PubMed
    1. Eguren M, Manchado E, Malumbres M. 2011. Non-mitotic functions of the anaphase-promoting complex. Seminars in Cell & Developmental Biology 22:572–578. doi: 10.1016/j.semcdb.2011.03.010 - DOI - PubMed
    1. Fujita T, Ikeda H, Kawasaki K, Taira N, Ogasawara Y, Nakagawara A, Doihara H. 2009. Clinicopathological relevance of UbcH10 in breast cancer. Cancer Science 100:238–248. doi: 10.1111/j.1349-7006.2008.01026.x - DOI - PMC - PubMed
    1. Fujita T, Liu W, Doihara H, Wan Y. 2009. An in vivo study of Cdh1/APC in breast cancer formation. International Journal of cancer 125:826–836. doi: 10.1002/ijc.24399 - DOI - PMC - PubMed

Publication types

MeSH terms

LinkOut - more resources

  NODES
INTERN 1
twitter 2