. 2014 Nov;141(21):4087-97.
doi: 10.1242/dev.107326.

Hmga2 regulates self-renewal of retinal progenitors

Affiliations

Hmga2 regulates self-renewal of retinal progenitors

Sowmya Parameswaran et al. Development. 2014 Nov.

Abstract

In vertebrate retina, histogenesis occurs over an extended period. To sustain the temporal generation of diverse cell types, retinal progenitor cells (RPCs) must self-renew. However, self-renewal and regulation of RPCs remain poorly understood. Here, we demonstrate that cell-extrinsic factors coordinate with the epigenetic regulator high-mobility group AT-hook 2 (Hmga2) to regulate self-renewal of late retinal progenitor cells (RPCs). We observed that a small subset of RPCs was capable of clonal propagation and retained multipotentiality of parents in the presence of endothelial cells (ECs), known self-renewal regulators in various stem cell niches. The self-renewing effects, also observed in vivo, involve multiple intercellular signaling pathways, engaging Hmga2. As progenitors exhaust during retinal development, expression of Hmga2 progressively decreases. Analyses of Hmga2-expression perturbation, in vitro and in vivo, revealed that Hmga2 functionally helps to mediate cell-extrinsic influences on late-retinal progenitor self-renewal. Our results provide a framework for integrating the diverse intercellular influences elicited by epigenetic regulators for self-renewal in a dynamic stem cell niche: the developing vertebrate retina.

Keywords: Epigenetic; Hmga2; Progenitors; Rat; Retina; Self-renewal; Stem cells.


Figures

Fig. 1.
Fig. 1.
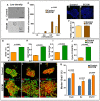
ECCM facilitates low cell density neurosphere generation. (A,B) ECCM facilitated neurosphere generation from E18 cells at a cell density (3.0×10⁴ cells/cm2) at which control (EGF) could not. (C) At higher cell densities (>3.0×10⁴ cells/well) neurospheres were generated in controls in significantly lower numbers versus ECCM (n=5). (D-F) TUNEL staining revealed no significant difference in cell survival between the two conditions (n=3). (G) A higher percentage of BrdU+ cells was observed in the ECCM groups versus controls (n=5). (H-J) An increase in Ki67, Pcna and Ccnd1 transcript levels was observed in the ECCM groups versus controls (n=3). (K-Q) Higher proportions of BrdU+ cells were observed in neurospheres expressing retinal (Pax6, Rx, Chx10) progenitor markers in the ECCM (N-Q) groups versus controls (n=5) (K-M,Q). Scale bars: 100 μm in A,B; 40 μm in D,E,K-P. Data are mean±s.e.m.
Fig. 2.
Fig. 2.
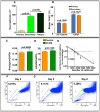
ECCM-generated neurospheres possess the ability to self-renew. (A) E18 cells generated primary, secondary and tertiary neurospheres, with a successive increase in their number with ECCM; neurospheres were not generated with EGF (n=5). (B) BrdU+ RPCs in both primary and secondary neurospheres generated β-tubulin+ neurons and GFAP+ glia in a similar proportion with FBS (n=3). (C,D) Q-PCR showed ECCM-exposed neurospheres generated rods (opsin mRNA) and bipolar cells (mGluR6 mRNA) in similar frequency to controls with PN1CM (n=3). (E) LDA analysis of the primary neurospheres in ECCM revealed a single limiting cell type, 1 in 1290 cells, generating secondary neurospheres (n=8). Data are mean±s.e.m. (F-H) Hoechst dye efflux assay on ECCM-exposed neurospheres showed a steady increase in SP cell numbers.
Fig. 3.
Fig. 3.
ECCM promotes RPC self-renewal in vivo. (A) Schematic of experiment. (B-D) Hoechst dye efflux assay on freshly dissociated PN3 retinal cells revealed (compared with RCM controls) an increase SP cell numbers in the ECCM-injected group, which was abrogated in nECCM-injected retinal cells. (E) The increase in the proportion of SP cells was reflected in increased BrdU+ cell numbers in the ECCM-injected retina versus RCM and nECCM groups (n=3). (F) Cells from ECCM-injected retina generated significantly more neurospheres compared with those from RCM- or nECCM-injected groups (n=3). Data are mean±s.e.m.
Fig. 4.
Fig. 4.
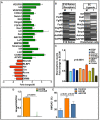
ECCM-exposed RPCs reveal a relative change in the transcriptional profile of select genes. (A) Graph obtained from the microarray data showed the differential expression of a select group of genes in ECCM-generated neurospheres versus controls (n=2). (B) RT-PCR analyses of E18 RPCs and ECs revealed complement receptor-ligand gene expression profiles of genes identified in the microarray analysis. Lane M, 100 bp ladder; lane 1, E18 RPCs. EC, endothelial cells. (C) Attenuation of signaling pathways using specific inhibitors or their cocktail significantly reduced the number of ECCM-generated secondary neurospheres (n=3). (D) ECCM-generated neurospheres revealed robust Hmga2 expression, abrogated with cocktail inhibitors (n=3). (E) Cell dissociates from ECCM/RCM/nECCM injected retina revealed a significant increase in the number of Hmga2+ cells in ECCM group versus RCM controls (n=3). Data are mean±s.e.m.
Fig. 5.
Fig. 5.
Expression of Hmga2 regulatory axis components correspond with RPC self-renewing properties. (A) Hmga2 expression during retinal development revealed a temporal decline and their absence in the adults (n=3). (B,C) Hmga2 immunoreactivities were predominantly colocalized in BrdU+ cells in the outer neuroblastic layer in E14 and E18 retina. (D-F) BrdU+ Hmga2+ cell numbers were significantly higher in ECCM-exposed neurospheres versus controls (n=3). (G,H) Correspondingly, there was a significant increase and decrease in the expression of Hmga2 (G) and its negative regulator Let7 (H) in ECCM-exposed neurospheres, with an inverse pattern of their expression in control neurospheres (n=3). (I-L) With cocktail inhibitors, there was a significant decrease in the Hmga2 transcript levels (I), with a concomitant increase in the expression of Let7 miRNA (J), and Junb (K) and p19arf (L) transcripts (n=3). Scale bars: 100 μm in B,C; 50 μm in D,E. Data are mean±s.e.m.
Fig. 6.
Fig. 6.
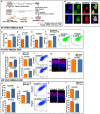
Hmga2 gain of function promotes RPC self-renewal in the absence of ECCM in vitro and in vivo. (A) E18 retinal cell dissociates (in vitro)/PN1 retina (in vivo)/E18 retinal explants (ex vivo) were transduced with Hmga2/Hmga2 (3′UTR DEL)+GFP/control GFP lentivirus and subjected to self-renewal and differentiation assays. (B-G) In cell dissociates of transduced neurospheres/retina/explants, infected RPCs were identified as GFP+ cells co-expressing Ki67/Pax6 immunoreactivities (B, arrowhead). Hmga2-lentivirus transduced RPCs generated more neurospheres than controls (C), and contained significantly higher numbers of GFP+Ki67+ (D)/GFP+Pax6+ (E)/BrdU+ (F) and SP (G) cells. (H-L) Hmga2-lentivirus transduced retina contained significantly more GFP+Ki67+ (H)/GFP+Pax6+ (I)/BrdU+ (J) cells, and RPCs therein generated significantly more neurospheres (K), containing higher numbers of SP cells (L) than controls. (M,N) Immunofluoresence analysis of gain-of-function retina at PN10 revealed no significant difference in the generation of rod photoreceptors (rhodopsin+ cells) compared with controls. (O-U) Hmga2-lentivirus transduced E18 retinal explants had increased numbers of GFP+Ki67+ (O)/GFP+Pax6+ (P)/BrdU+ (Q) and SP (R) cells at day 4, and decreased numbers of rod photoreceptors (S), as estimated by rhodopsin+ cells (T) and GFP+ rhodopsin+ cell quantifications (U) versus controls at day 10. Scale bars: 50 μm. Data are mean±s.e.m. All the experiments were carried out three times in triplicates with four animals/group (in vivo perturbation); nine retinae per group (ex vivo perturbation); 10-12 E18 embryos per group (in vitro perturbation).
Fig. 7.
Fig. 7.
Hmga2 loss-of-function compromises ECCM-mediated RPC self-renewal in vitro and in vivo. E18 retinal cell dissociates (in vitro)/PN1 retina (in vivo)/E18 retinal explants (ex-vivo) were transduced with Hmga2siRNA+GFP/control GFP lentivirus, and subjected to self-renewal and differentiation assays as described in Fig. 6A,B. (A-E) Hmga2 siRNA-lentivirus transduced RPCs generated fewer neurospheres than controls (A) and contained significantly lower numbers of GFP+Ki67+ (B)/GFP+Pax6+ (C)/BrdU+ (D) and SP (E) cells. (F-J) Hmga2 siRNA-lentivirus transduced retina contained significantly fewer GFP+Ki67+ (F)/GFP+Pax6+ (G)/BrdU+ (H) cells, and RPCs therein generated significantly fewer neurospheres (I), containing fewer SP (J) cells than controls. (K,L) Immunofluoresence analysis of loss-of-function retina at PN10 revealed no significant difference in the generation of rod photoreceptors (rhodopsin+ cells) compared with controls. (M-S) Hmga2 siRNA-lentivirus transduced E18 retinal explants had decreased numbers of GFP+Ki67+ (M)/GFP+Pax6+ (N)/BrdU+ (O) and SP (P) cells at day 4 and increased numbers of rod photoreceptors (Q), as estimated by rhodopsin+ cells (R) and GFP+ rhodopsin+ cell quantifications (S) compared with controls at day 10. Scale bars: 50 μm. Data are mean±s.e.m. All the experiments were carried out three times in triplicates with four animals/group (in vivo perturbation); nine retinae per group (ex vivo perturbation); 10-12 E18 embryos per group (in vitro perturbation).

Similar articles

Cited by

References

    1. Agathocleous M. and Harris W. A. (2009). From progenitors to differentiated cells in the vertebrate retina. Annu. Rev. Cell Dev. Biol. 25, 45-69 10.1146/annurev.cellbio.042308.113259 - DOI - PubMed
    1. Ahmad I., Dooley C. M., Thoreson W. B., Rogers J. A. and Afiat S. (1999). In vitro analysis of a mammalian retinal progenitor that gives rise to neurons and glia. Brain Res. 831, 1-10 10.1016/S0006-8993(99)01376-1 - DOI - PubMed
    1. Ahmad I., Das A. V., James J., Bhattacharya S. and Zhao X. (2004). Neural stem cells in the mammalian eye: types and regulation. Semin. Cell Dev. Biol. 15, 53-62 10.1016/j.semcdb.2003.09.003 - DOI - PubMed
    1. Andreu-Agulló C., Morante-Redolat J. M., Delgado A. C. and Fariñas I. (2009). Vascular niche factor PEDF modulates Notch-dependent stemness in the adult subependymal zone. Nat. Neurosci. 12, 1514-1523 10.1038/nn.2437 - DOI - PubMed
    1. Bhattacharya S., Jackson J. D., Das A. V., Thoreson W. B., Kuszynski C., James J., Joshi S. and Ahmad I. (2003). Direct identification and enrichment of retinal stem cells/progenitors by Hoechst dye efflux assay. Invest. Ophthalmol. Vis. Sci. 44, 2764-2773 10.1167/iovs.02-0899 - DOI - PubMed

Publication types

  NODES
chat 2
twitter 2