. 2015 Mar 17;42(3):431-42.
doi: 10.1016/j.immuni.2015.02.013.

Epigenetic modification and antibody-dependent expansion of memory-like NK cells in human cytomegalovirus-infected individuals

Affiliations

Epigenetic modification and antibody-dependent expansion of memory-like NK cells in human cytomegalovirus-infected individuals

Jaewon Lee et al. Immunity. .

Abstract

Long-lived "memory-like" NK cells have been identified in individuals infected by human cytomegalovirus (HCMV), but little is known about how the memory-like NK cell pool is formed. Here, we have shown that HCMV-infected individuals have several distinct subsets of memory-like NK cells that are often deficient for multiple transcription factors and signaling proteins, including tyrosine kinase SYK, for which the reduced expression was stable over time and correlated with epigenetic modification of the gene promoter. Deficient expression of these proteins was largely confined to the recently discovered FcRγ-deficient NK cells that display enhanced antibody-dependent functional activity. Importantly, FcRγ-deficient NK cells exhibited robust preferential expansion in response to virus-infected cells (both HCMV and influenza) in an antibody-dependent manner. These findings suggest that the memory-like NK cell pool is shaped and maintained by a mechanism that involves both epigenetic modification of gene expression and antibody-dependent expansion.


Figures

Figure 1
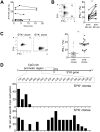
Figure 1. Gene expression analysis and identification of SYK-deficiency in FcRγ- NK cells
(A) PBMCs from two individual donors were stained with Ab against surface molecules, then fixed prior to intracellular staining for FcRγ. Dot plots depict sorting strategies for enrichment of CD56+CD3-CD19-CD14- FcRγ-NK cells and conventional NK cells using cell surface markers; NKG2C (Donor #214, 94% conventional NK and 89% FcRγ-NK cell purity) or KIR2DL2 (Donor #221, 85% conventional NK and 76% FcRγ-NK cell purity). (B) Based on microarray analysis, several cell surface markers were selected for protein expression analysis. Histograms show fluorescence on FcRγ-NK cells (bold line) and conventional NK cells (thin line) compared to control staining (shaded peak), and are representative of at least 7 donors analyzed in at least two independent experiments. (C) Bar graph shows fold differences in transcripts encoding the indicated proteins that function downstream of CD16 signaling between FcRγ-NK and conventional NK cells from two donors, e.g., SYK mRNA in FcRγ-NK cells from Donor #214 amounted to less than 5% of that in conventional NK cells. (D) Analysis of intracellular expression of SYK and ZAP70 proteins in FcRγ-NK and conventional NK cells. Histograms show expression amounts of indicated proteins in a control donor (#204), and donors #214 and #221; FcRγ-NK cells (bold line), conventional NK cells (thin line), and control (shaded peak).
Figure 2
Figure 2. Association of SYK-deficient NK cells with prior HCMV infection
(A) PBMCs from many donors were analyzed for the presence of SYK-deficient (SYK-) or ZAP70-deficient (ZAP70-) NK cells. Dot graphs show the frequency of SYK-deficient (n=62) and ZAP70-deficient (n=36) cells among total NK cells. (B) Frequencies of SYK-deficient NK cells within individual donors (n=62) grouped according to IgG serological status for HCMV, HSV-1, or HSV-2 infection. (C) Frequencies of SYK-deficient NK cells within individual donors (n=62) grouped according to IgG serological status for one, two, or three specific herpesvirus infections. ns, not significant, * P < 0.05, ** P < 0.005.
Figure 3
Figure 3. Stability of SYK-deficient phenotype associated with DNA hyper-methylation
(A) Frequency of SYK-deficient NK cells collected at the initial time point and indicated months later from 8 healthy donors. (B) Dot plot shows IFN-γ production by indicated subsets of NK cells from a representative donor among 15 individuals after stimulation with immobilized anti-CD16 for 7 h. Numbers represent the percentage of FcRγ-NK and conventional NK cells. Dot graphs show the percentage of SYK-expressing NK cells and SYK-deficient NK cells that produced IFN-γ. Circles connected by a line designate the same donor sample (n=15) ** P < 0.01. (C) NK cell clones were generated via limiting dilution of sorted NK cells, then tested for functionality after CD16 stimulation. Dot plots show IFN-γ production by two representative clones from five independent experiments. Numbers represent the percentage of cells that produced IFN-γ. Dot graph shows the percentage of cells that produced IFN-γ following stimulation of SYK-expressing (○) and SYK-deficient clones (●) (n=20 each). Each dot represents an individual clone and bars indicate the mean +/- SEM percentage of IFN-γ producing cells for each group. ** P < 0.01. (D) Schematic diagram of the SYK gene including the promoter-associated CpG island and translation start codon. Arrow represents the transcription initiation site. Expanded region details the location of 20 specific CpG dinucleotides as potential methylation sites. Bar graphs below show the percentage of methylation detected at each individual site in SYK-expressing and SYK-deficient NK cell clones. Data shown is from one donor; similar patterns were observed from 2 additional donors. See also Figure S1.
Figure 4
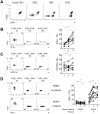
Figure 4. Association and functional impact of SYK deficiency with FcRγ deficiency in NK cells
(A) Flow cytometric analysis of FcRγ vs. SYK expression in CD56+CD3-CD19-CD14- NK cells from 4 representative donors. (B) Dot plots show IFN-γ production by indicated subsets of NK cells from a representative donor among 10 individuals after CD16 stimulation. Numbers represent the percentage of NK cells within the designated quadrants. Dot graphs show the percentage of SYK-expressing conventional NK cells (FcRγ+SYK+; I), SYK-expressing FcRγ-NK cells (FcRγ-SYK+; II), or SYK-deficient FcRγ-NK cells (FcRγ-SYK-; III) that produced IFN-γ from several donors. Circles connected by a line designate the same donor sample (n=10). (C) Cell surface expression of CD107a was determined following stimulation as in (B). Numbers represent the percentage of NK cells within the designated quadrants. Dot graph shows the percentage of SYK-expressing conventional NK cells (I), SYK- expressing FcRγ-NK cells (II), or SYK-deficient FcRγ-NK cells (III) that displayed CD107a (n=10). (D) PBMCs were cultured for 3 days with mock- or HCMV-infected MRC-5 cells, with the last 6 hours in the presence or absence of autologous plasma as indicated. Dot plots show IFN-γ production by NK cells from one representative donor among 9 individuals, and dot graph shows the percentage of NK cells that produced IFN-γ in SYK-expressing conventional NK cells (I), SYK-expressing FcRγ-NK cells (II), or SYK-deficient FcRγ-NK cells (III) from several donors (n=9) +/- autologous plasma. ns, not significant; * P < 0.05 and ** P < 0.01.
Figure 5
Figure 5. Multiple protein deficiencies correlate with FcRγ-deficiency
PBMCs were co-stained for FcRγ and transcription factor PLZF (A), signaling molecules DAB2 (B) and EAT-2 (C). Shown are dot plots depicting CD56+CD3-CD19-CD14- NK cells from a representative HCMV seropositive donor among at least 7 HCMV- seropositive individuals. Dot graphs show mean fluorescence intensity (MFI) of indicated proteins in CD3+CD56- T cells (T), conventional NK cells (NK) and FcRγ-NK cells from HCMV seronegative and seropositive donors. MFIs were each normalized by subtraction of the MFI from control staining. Symbols connected by lines are from the same donor sample. (D) PBMCs were co-stained for FcRγ and transcription factor IKZF2. Shown are dot plots depicting CD56+CD3-CD19-CD14- NK cells from one HCMV seronegative and three representative HCMV seropositive donors as indicated. All data are representative of at least two independent experiments.
Figure 6
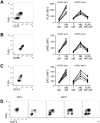
Figure 6. Ab-dependent expansion of FcRγ-NK cell population in response to HCMV-infected _target cells
(A) PBMCs were cultured in the presence of mock- or HCMV-infected _target cells with or without autologous plasma as indicated. Dot plots show NK cells from one representative donor among 14 individuals before and after 11-13 d culture in indicated conditions. Numbers represent the percentage of FcRγ-NK cells. Dot graph depicts the change in frequencies of conventional (○) and FcRγ-NK cells (●) compared to initial frequencies for individual donors after culturing for 11-13 d as indicated (n=14). (B) Bar graph depicts absolute numbers of conventional (○) and FcRγ-NK cells (●) from one representative donor among 14 individuals after culture in indicated conditions as described in (A). Dot graph shows the fold change in the absolute number of NK cells based on the absolute number of NK cells obtained from the control condition (PBMCs cultured with mock-infected cells without plasma) for each individual donor (n=14). The mean +/- SEM are indicated. (C) NK cells were sorted from PBMCs and cultured as described in (A). Dot plots show NK cells from one representative donor among 9 individuals cultured for 11 d as indicated. Purified IgG (Ab) was also tested. Numbers represent percentages of FcRγ- NK cells. (D) Dot graph depicts the fold change in the absolute number of NK cells based on the absolute number of NK cells obtained from the control condition (PBMCs cultured with mock-infected cells plus plasma) for each individual donor (n=9, ** P < 0.01).
Figure 7
Figure 7. Ab-dependent expansion of FcRγ-NK cells in response to flu-infected _target cells
(A) PBMCs were co-cultured with flu-infected _target cells in the presence (+) or absence (-) of autologous plasma as indicated. Dot plots show NK cells from one representative donor among 8 individuals after 11 d culture in indicated conditions. Numbers represent the percentage of FcRγ-NK cells. Dot graph depicts the change in frequencies of conventional NK (○) and FcRγ-NK cells (●) compared to initial frequencies for individual donors after culture for 11 d in indicated conditions (n=8). (B) Dot graph shows the fold change in the absolute number of conventional NK (○) and FcRγ-NK (●) cells after culture in indicated conditions as described in (A). Fold change is based on the absolute number obtained from the control culture (PBMCs cultured with flu-infected cells without plasma) for each individual donor. The mean +/- SEM are indicated (n=8, ** P < 0.01).

Similar articles

Cited by

References

    1. Beziat V, Dalgard O, Asselah T, Halfon P, Bedossa P, Boudifa A, Hervier B, Theodorou I, Martinot M, Debre P, et al. CMV drives clonal expansion of NKG2C+ NK cells expressing self-specific KIRs in chronic hepatitis patients. Eur J Immunol. 2012;42:447–457. - PubMed
    1. Beziat V, Liu L, Malmberg JA, Ivarsson MA, Sohlberg E, Bjorklund AT, Retiere C, Sverremark-Ekstrom E, Traherne J, Ljungman P, et al. NK cell responses to cytomegalovirus infection lead to stable imprints in the human KIR repertoire and involve activating KIRs. Blood 2013 - PMC - PubMed
    1. Biron CA, Byron KS, Sullivan JL. Severe herpesvirus infections in an adolescent without natural killer cells. N Engl J Med. 1989;320:1731–1735. - PubMed
    1. Bjorkstrom NK, Lindgren T, Stoltz M, Fauriat C, Braun M, Evander M, Michaelsson J, Malmberg KJ, Klingstrom J, Ahlm C, Ljunggren HG. Rapid expansion and long-term persistence of elevated NK cell numbers in humans infected with hantavirus. The Journal of experimental medicine. 2011;208:13–21. - PMC - PubMed
    1. Brunetta E, Fogli M, Varchetta S, Bozzo L, Hudspeth KL, Marcenaro E, Moretta A, Mavilio D. Chronic HIV-1 viremia reverses NKG2A/NKG2C ratio on natural killer cells in patients with human cytomegalovirus co-infection. AIDS. 2010;24:27–34. - PubMed

Publication types

MeSH terms

Associated data

  NODES
Association 6
Project 1
twitter 2