. 2015 Oct:87:36-47.
doi: 10.1016/j.freeradbiomed.2015.05.042. Epub 2015 Jun 12.

_targeting mitochondrial reactive oxygen species to modulate hypoxia-induced pulmonary hypertension

Affiliations

_targeting mitochondrial reactive oxygen species to modulate hypoxia-induced pulmonary hypertension

Sherry E Adesina et al. Free Radic Biol Med. 2015 Oct.

Abstract

Pulmonary hypertension (PH) is characterized by increased pulmonary vascular remodeling, resistance, and pressures. Reactive oxygen species (ROS) contribute to PH-associated vascular dysfunction. NADPH oxidases (Nox) and mitochondria are major sources of superoxide (O(2)(•-)) and hydrogen peroxide (H(2)O(2)) in pulmonary vascular cells. Hypoxia, a common stimulus of PH, increases Nox expression and mitochondrial ROS (mtROS) production. The interactions between these two sources of ROS generation continue to be defined. We hypothesized that mitochondria-derived O(2)(•-) (mtO(2)(•-)) and H(2)O(2) (mtH(2)O(2)) increase Nox expression to promote PH pathogenesis and that mitochondria-_targeted antioxidants can reduce mtROS, Nox expression, and hypoxia-induced PH. Exposure of human pulmonary artery endothelial cells to hypoxia for 72 h increased mtO(2)(•-) and mtH(2)O(2). To assess the contribution of mtO(2)(•-) and mtH(2)O(2) to hypoxia-induced PH, mice that overexpress superoxide dismutase 2 (Tg(hSOD2)) or mitochondria-_targeted catalase (MCAT) were exposed to normoxia (21% O(2)) or hypoxia (10% O(2)) for three weeks. Compared with hypoxic control mice, MCAT mice developed smaller hypoxia-induced increases in RVSP, α-SMA staining, extracellular H(2)O(2) (Amplex Red), Nox2 and Nox4 (qRT-PCR and Western blot), or cyclinD1 and PCNA (Western blot). In contrast, Tg(hSOD2) mice experienced exacerbated responses to hypoxia. These studies demonstrate that hypoxia increases mtO(2)(•-) and mtH(2)O(2). _targeting mtH(2)O(2) attenuates PH pathogenesis, whereas _targeting mtO(2)(•-) exacerbates PH. These differences in PH pathogenesis were mirrored by RVSP, vessel muscularization, levels of Nox2 and Nox4, proliferation, and H(2)O(2) release. These studies suggest that _targeted reductions in mtH(2)O(2) generation may be particularly effective in preventing hypoxia-induced PH.

Keywords: Catalase; Hydrogen peroxide; Mitochondria; NADPH oxidase; Pulmonary hypertension; ROS; SOD2; Superoxide.


Figures

Figure 1
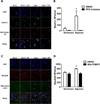
Figure 1. Hypoxia increases mtROS generation, Nox2, Nox4, CyclinD1, and PCNA mRNA in HPAECs
HPAECs were exposed to normoxia (21%O2) or hypoxia (1%O2) for 72 hours. Following exposure, cells were assessed for mitochondrial O2•− and H2O2 by confocal microscopy. (A) HPAECs were treated with 1000 U/mL PEG-catalase or DMSO vehicle during the last 24 hours of exposure, treated with MitoPy1, MitroTracker red, and Dapi. Representative images at 90× magnification presented, scale bar 10 µm. (B) The fluorescence intensity in 50 – 100 cells from each treatment group and is presented as mean ± SEM MitoPy1 relative fluorescence units (RFU)/cell. PEG-Catalase treatment prevents hypoxia induced mtH2O2 production (n = 3), *p < 0.05 compared to all other groups. (C) HPAECs were treated with 100 nM MitoTEMPO or DMSO vehicle daily and then treated with MitoSOX, MitoTracker green, and DAPI. Representative images at 90× magnification. (D) The fluorescence intensity in each treatment group was measured in 50 – 100 cells and is presented as mean ± SEM MitoSOX RFU/cell. MitoTEMPO treatment prevents hypoxia induced mtO2•− production (n = 3), *p < 0.05 compared to all other groups.
Figure 2
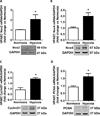
Figure 2. Hypoxia increases Nox2, Nox4, CyclinD1, and PCNA mRNA and protein in HPAECs
HPAECs were exposed to normoxia (21%O2) or hypoxia (1%O2) for 72 hours. Following exposure, cells were harvested and Nox expression and proliferation markers were assessed by qRT-PCR (relative to GAPDH expressed as fold-change vs. Normoxia) and western blot (normalized to GAPDH). Hypoxia increases expression levels of (A) Nox2 and (B) Nox4 and increases levels of the proliferation markers (C) cyclinD1 and (D) PCNA. Each bar represents mean ± SEM (n = 3), *p < 0.05 compared to Normoxia.
Figure 3
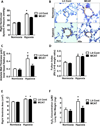
Figure 3. Mitochondrial-_targeted catalase overexpression attenuates hypoxia-induced PH and muscularization of small pulmonary arteries
Littermate control (Lit Cont) and MCAT mice were exposed normoxia (21% O2) or hypoxia (10% O2) for 3-weeks in 3 separate studies. (A) Right ventricular systolic pressure (RVSP) was recorded with a pressure transducer. MCAT expression able to prevent hypoxia-induced elevations in RVSP. Each bar represents mean ± SEM RVSP in mmHg (n = 10), *p < 0.05 compared to all other groups. (B) Lung sections (5 µm thick) were stained with α-SMA. Representative images are displayed as indicated. Brown staining indicated by arrows represents α-SMA positive staining in the media of small pulmonary arterioles. Magnification = 40×. (C) The wall thickness calculated by dividing total thickness of vessel by inner vessel radius. MCAT expression able to prevent hypoxia-induced elevations in α-SMA staining of small arterioles (n = 3 – 4), *p < 0.05 compared to all other groups. (D) Right ventricular hypertrophy was assessed by dissecting and weighing the right ventricle (RV) and the left ventricle + septum (LV + S) and calculating the RV:LV+S weight ratio. Hypoxia induces elevations in RVH. Each bar represents the mean ± SEM RV:LV+S weight ratio (n = 7 – 8), *p < 0.05 compared to both normoxia groups. (E) Right ventricular hypertrophy was also assessed by cardiac echocardiography and measurement of the right ventricular area. Each bar represents mean ± SEM RV area in cm2. Hypoxia increases right ventricular area (n = 7 – 8), *p < 0.05 compared to both normoxia groups. Amplex Red assay was utilized to assess lung extracellular H2O2 levels in lung tissue. (F) MCAT expression significantly decreased hypoxia-induced H2O2 production. Each bar represents mean ± SEM H2O2 concentration relative to lung tissue wet weight (n = 5 – 6), *p < 0.05 compared to all other groups.
Figure 4
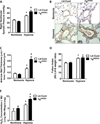
Figure 4. SOD2 overexpression exacerbates hypoxia-induced RVSP, RVH, and muscularization of small pulmonary arteries
Littermate control (Lit Cont) and TghSOD2 mice were exposed normoxia (21% O2) or hypoxia (10% O2) for 3-weeks in 2 independent studies. (A) RVSP was recorded with a pressure transducer. Hypoxia elevates RVSPs, which is exacerbated in TghSOD2 mice. Each bar represents mean ± SEM RVSP in mm Hg (n = 4 – 5), *p < 0.05 compared to Lit Cont Normoxia and #p < 0.05 compared to Lit Cont Hypoxia. (B) Lung sections (5 µm thick) were stained with α-SMA. Representative images are displayed as indicated. Brown staining indicated by arrows represents α-SMA positive staining in the media of small pulmonary arterioles. Magnification = 40×. (C) The wall thickness calculated by dividing total thickness of vessel by inner vessel radius. TghSOD2 mice has exacerbated hypoxia-induced α-SMA staining of small arterioles (n = 3), *p < 0.05 compared to Lit Cont Normoxia and #p < 0.05 compared to Lit Cont Hypoxia. (D) TghSOD2 expression had no significant effect on hypoxia-induced RVH. Each bar represents the mean ± SEM RV:LV+S weight ratio (n = 8 – 12), *p < 0.05 compared to both Normoxia groups. (E) TghSOD2 expression significantly increased hypoxia- induced H2O2 production. Each bar represents mean ± SEM H2O2 concentration relative to lung tissue wet weight (n = 5 – 9), *p < 0.05 compared to Lit Cont Normoxia and #p < 0.05 compared to Lit Cont Hypoxia.
Figure 5
Figure 5. mtH2O2 attenuation prevents hypoxia-induced Nox expression
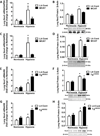
Lit Cont and MCAT mice were exposed to normoxic or hypoxic conditions for 3 weeks. Whole lung homogenates were collected from Lit Cont, MCAT, and TghSOD2 mice. Nox mRNA values are relative to GAPDH, or 9S and expressed as fold-change vs. Normoxia. Protein samples are normalized to β-Actin. (A) MCAT expression attenuated hypoxiainduced Nox2 mRNA. Each bar represents mean ± SEM lung Nox2 mRNA (n = 9), *p < 0.05 compared to all other groups. (B) MCAT expression inhibited hypoxia-induced Nox2 protein levels. Each bar represents mean ± SEM lung Nox2 protein (n = 2 – 3), *p < 0.05 compared to all other groups. (C) MCAT expression prevented elevation of hypoxia-induced Nox4 mRNA levels. Each bar represents mean ± SEM lung Nox4 mRNA (n = 7 – 10), *p < 0.05 compared to all other groups. (D) Nox4 hypoxia-induced protein expression was attenuated in MCAT mice. Each bar represents mean ± SEM lung Nox4 protein (n = 3 – 4), *p < 0.05 compared to all other groups. (E) Hypoxia-induced lung Nox2 mRNA expression was exacerbated in TghSOD2. Each bar represents mean ± SEM lung Nox2 mRNA (n = 6 – 11), *p < 0.05 compared to Lit Cont Normoxia and #p < 0.05 compared to Lit Cont Hypoxia. (F) Hypoxia elevates lung Nox2 protein in both Lit Cont and TghSOD2. Each bar represents mean ± SEM lung Nox2 protein (n = 3), *p < 0.05 compared to all other groups. (G) Hypoxia-induced Nox4 mRNA expression is exacerbated in hypoxia-exposed TghSOD2. Each bar represents mean ± SEM lung Nox4 mRNA (n = 6), *p < 0.05 compared to Lit Cont Normoxia and #p < 0.05 compared to Lit Cont Hypoxia. (H) Hypoxia increases lung Nox4 protein in Lit Cont and this increase is exacerbated in the hypoxia TghSOD2 model. Each bar represents mean ± SEM lung Nox4 protein (n = 3 – 4), *p < 0.05 compared to Lit Cont Normoxia and #p < 0.05 compared to Lit Cont Hypoxia.
Figure 6
Figure 6. _targeted attenuation of mtH2O2 prevents hypoxia-induced proliferation
Lit Cont and transgenic mice were exposed to normoxic or hypoxic conditions for 3 weeks. Whole lung homogenates were collected from Lit Cont, MCAT, and TghSOD2 mice. MCAT expression prevented hypoxia-induced induction of cyclinD1 and PCNA protein expression. CyclinD1 and PCNA values are normalized to β-Actin or CDK4. (A) MCAT expression inhibited hypoxia-induced elevation of cyclinD1 protein. Each bar represents mean ± SEM lung cyclinD1 protein (n = 5 – 6), *p < 0.05 compared to all other groups. (B) MCAT expression inhibited hypoxia-induced elevation of PCNA protein. Each bar represents mean ± SEM lung PCNA protein (n =3 – 5), *p < 0.05 compared to all other groups. (C) TghSOD2 mice displayed exacerbated hypoxia-induced cyclinD1 protein expression. Each bar represents mean ± SEM lung cyclinD1 protein (n = 3 – 5), *p < 0.05 compared to Lit Cont Normoxia and #p < 0.05 compared to Lit Cont Hypoxia. (D) TghSOD2 mice also displayed exacerbated hypoxia-induced PCNA protein expression. Each bar represents mean ± SEM lung PCNA protein (n =3 – 6), *p < 0.05 compared to Lit Cont Normoxia and #p < 0.05 compared to Lit Cont Hypoxia.
Figure 7
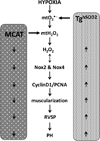
Figure 7. Schematic representation of the role of mitochondria ROS in the development of PH
_targeted attenuation of mtH2O2 with MCAT model (left side of schema) prevents hypoxia-induced PH molecular and physiological derangements. Conversely, _targeted inhibition of mtO2•− (right side of schema) exacerbates hypoxia-induced derangements that contribute to PH pathogenesis.

Similar articles

Cited by

References

    1. Rabinovitch M. Molecular pathogenesis of pulmonary arterial hypertension. The Journal of clinical investigation. 2008;118:2372–2379. - PMC - PubMed
    1. Sakao S, Tatsumi K, Voelkel NF. Endothelial cells and pulmonary arterial hypertension: apoptosis, proliferation, interaction and transdifferentiation. Respir Res. 2009;10:95. - PMC - PubMed
    1. Weir EK, Archer SL. The role of redox changes in oxygen sensing. Respiratory physiology & neurobiology. 2010;174:182–191. - PMC - PubMed
    1. Fike CD, Slaughter JC, Kaplowitz MR, Zhang Y, Aschner JL. Reactive oxygen species from NADPH oxidase contribute to altered pulmonary vascular responses in piglets with chronic hypoxia-induced pulmonary hypertension. American journal of physiology. Lung cellular and molecular physiology. 2008;295:L881–L888. - PMC - PubMed
    1. Liu JQ, Folz RJ. Extracellular superoxide enhances 5-HT-induced murine pulmonary artery vasoconstriction. American Journal of Physiology - Lung Cellular and Molecular Physiology. 2004;287:L111–L118. - PubMed

Publication types

MeSH terms

  NODES
twitter 2