. 2015 Aug;27(8):2210-26.
doi: 10.1105/tpc.15.00231. Epub 2015 Aug 7.

Flavonoids and Auxin Transport Inhibitors Rescue Symbiotic Nodulation in the Medicago truncatula Cytokinin Perception Mutant cre1

Affiliations

Flavonoids and Auxin Transport Inhibitors Rescue Symbiotic Nodulation in the Medicago truncatula Cytokinin Perception Mutant cre1

Jason Liang Pin Ng et al. Plant Cell. 2015 Aug.

Abstract

Initiation of symbiotic nodules in legumes requires cytokinin signaling, but its mechanism of action is largely unknown. Here, we tested whether the failure to initiate nodules in the Medicago truncatula cytokinin perception mutant cre1 (cytokinin response1) is due to its altered ability to regulate auxin transport, auxin accumulation, and induction of flavonoids. We found that in the cre1 mutant, symbiotic rhizobia cannot locally alter acro- and basipetal auxin transport during nodule initiation and that these mutants show reduced auxin (indole-3-acetic acid) accumulation and auxin responses compared with the wild type. Quantification of flavonoids, which can act as endogenous auxin transport inhibitors, showed a deficiency in the induction of free naringenin, isoliquiritigenin, quercetin, and hesperetin in cre1 roots compared with wild-type roots 24 h after inoculation with rhizobia. Coinoculation of roots with rhizobia and the flavonoids naringenin, isoliquiritigenin, and kaempferol, or with the synthetic auxin transport inhibitor 2,3,5,-triiodobenzoic acid, rescued nodulation efficiency in cre1 mutants and allowed auxin transport control in response to rhizobia. Our results suggest that CRE1-dependent cytokinin signaling leads to nodule initiation through the regulation of flavonoid accumulation required for local alteration of polar auxin transport and subsequent auxin accumulation in cortical cells during the early stages of nodulation.


Figures

Figure 1.
Figure 1.
Relative Auxin Transport Changes in Wild-Type (A17) and cre1 Mutant Roots. (A) and (B) Acropetal (A) and basipetal (B) auxin transport measurements 24 h after mock or E65 inoculation in a segment just below (for acropetal) and above (for basipetal) the inoculation site, respectively. (C) and (D) Acropetal auxin transport measurements in A17 (C) and cre1 mutant (D) roots 24 h after mock or BAP treatment (10−7 M) in a segment just below the mock or BAP application sites. Control treatments were set to “1” in each case. A two-way ANOVA with a Tukey-Kramer multiple comparison post-test was used for statistical analyses in (A) and (B) (P < 0.05, n = 15 to 20). Different lowercase letters indicate significant differences in relative auxin transport rate. A Student’s t test was used for statistical analyses in (C) and (D) (P < 0.05, n = 20), where asterisks in (C) indicate an extremely very significant difference in relative auxin transport rate (P < 0.001). Graphs show mean and sd.
Figure 2.
Figure 2.
Auxin Concentration in Wild-Type (A17) and cre1 Mutant Roots at 6 and 24 h after Mock or E65 Inoculation. (A) and (B) IAA concentration. (C) and (D) IBA concentration. (E) and (F) IAA-Ala concentration. A three-way ANOVA with a Bonferroni post-test was used for statistical analyses. Asterisk in (A) indicates a significant difference in IAA concentration with a Bonferroni post-test (P < 0.05; n = 5 to 6). Each biological replicate consists of at least 30 root segments. Graphs show mean and sd.
Figure 3.
Figure 3.
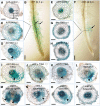
Auxin Response (GH3:GUS Expression) Is Localized to Dividing Cells during the Early Stages of Nodule and Pseudonodule Development. (A) Auxin response in a mock-treated wild-type (A17) root. (B) Auxin response is localized to the root hairs and underlying cortex directly below the root hairs of an A17 root spot-inoculated with E65 at 24 hpi. (C) Cross section of (B). (D) Auxin response in the dividing pericycle, endodermal, and cortical cells during early symbiotic stages in an A17 root inoculated with E65 at 48 hpi. (E) Auxin response in a mock-treated cre1 mutant root. (F) Auxin response is absent in the root cortex but present in the root hairs of a cre1 mutant root spot-inoculated with E65 at 24 hpi. (G) Cross section of (F). (H) In most of cre1 mutant roots, no cell divisions occur in response to E65 inoculation at 48 hpi. (I) Dividing cells in cre1 mutants are associated with an enhanced auxin response and are observed in <5% of cre1 mutant roots inoculated with E65. (J) and (K) Auxin response in the dividing cells of A17 (J) and cre1 (K) roots in response to TIBA treatment. (L) to (O) Auxin response in a cre1 nodule primordium rescued with naringenin (L), isoliquiritigenin (M), kaempferol (N), and quercetin (O). (P) No enhanced auxin response or cell divisions were observed in hesperetin-treated roots. Arrowheads indicate nodule primordia. Arrows indicate auxin response in the root hairs and/or the root cortex. At least 30 individual samples were observed for each treatment. Horizontal and vertical scale bars represent 100 µm and 1 mm, respectively. ep, epidermis; c, cortex; en, endodermis; p, pericycle.
Figure 4.
Figure 4.
RT-qPCR Showing Transcript Abundance in Root Segments of the Wild Type (A17) and cre1 Mutants Inoculated for 6 and 24 h with E65 Relative to Mock-Treated Roots. Expression was normalized to the GAPDh reference gene. The auxin response gene GH3 (A) and the IAA exporter-encoding genes PIN2, PIN4, and PIN10 (B) were analyzed. A two-way ANOVA with a Tukey-Kramer multiple comparison post-test was used for statistical analyses (P < 0.05, n = 3). Different lowercase letters indicate significant differences in transcript abundance within each gene. Each biological replicate consists of at least 50 root segments. Graphs show mean and sd.
Figure 5.
Figure 5.
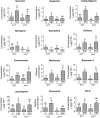
Concentrations of Major Flavonoids in Wild-Type (A17) and cre1 Mutant Root Segments 24 h after Mock or E65 Inoculation. Flavonoids analyzed include the flavanones (naringenin and hesperetin), flavonols (quercetin, kaempferol, and morin), isoflavonoids (isoliquiritigenin, liquiritigenin, medicarpin, formononetin, daidzein, and biochanin A), and a flavone (chrysoeriole). Relative quantification was performed on chrysoeriol and medicarpin, where commercial standards were not available. A two-way ANOVA with a Tukey-Kramer multiple comparison post-test was used for statistical analyses (P < 0.05, n = 3 to 5). Different lowercase letters indicate statistically significant differences between treatments. A total of 15 root segments were harvested for each biological replicate. Graphs show mean and sd.
Figure 6.
Figure 6.
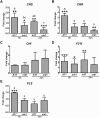
RT-qPCR Showing Transcript Abundance of Flavonoid-Related Genes in Root Segments. Transcript abundance of flavonoid-related genes in the wild type (A17) and the cre1 mutant inoculated for 6 and 24 h with E65 relative to mock-treated roots. Expression was normalized to the GAPDh reference gene. CHS (A), CHR (B), CHI (C), F3′H (D), and FLS (E) genes were analyzed. A Student’s t test was used for statistical analyses between roots inoculated with E65 relative to mock-treated roots (fold change) (P < 0.05, n = 3). Asterisks indicate significant differences in induction/repression in roots inoculated with E65 relative to mock-treated roots within individual treatments. A two-way ANOVA with a Tukey-Kramer multiple comparison post-test was used for statistical analyses between genotypes (P < 0.05, n = 3). Different lowercase letters indicate significant differences in induction/repression between A17 and cre1 mutants. Graphs show mean and sd.
Figure 7.
Figure 7.
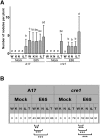
Complementation of Nodulation in cre1 Mutants Using Flavonoids or the Synthetic Auxin Transport Inhibitor TIBA. Nodules were quantified 3 weeks after treatment. (A) Number of nodules forming on wild-type (A17) and cre1 mutant roots, with or without E65 inoculation and various treatments. Note that nodules formed with TIBA in the absence of rhizobia were uninfected pseudonodules. A three-way ANOVA with a Tukey-Kramer multiple comparison post-test was used for statistical analysis (P < 0.05, n = 35). Different lowercase letters indicate statistically significant difference in nodule numbers per plant between treatments. Graph shows mean and sd. W, water; K, 3 µM kaempferol; N, 3 µM naringenin; iL, 3 µM isoliquiritigenin; T, 50 µM TIBA. (B) Percentage of plants forming nodules in A17 and cre1 mutants. A two-sample t test was used for statistical analyses between treatments (**P < 0.01 and ***P < 0.001; n = 35).
Figure 8.
Figure 8.
Nodules Restored on cre1 Mutant Roots Treated with Selected Flavonoids Are Infected by Rhizobia. Nodules were quantified 3 weeks after treatment. (A) to (C) Wild-type (A17) roots inoculated with E65 without gfp to show background autofluorescence under GFP excitation. (D) to (F) A17 roots inoculated with a gfp-expressing Sm1021 pE65 strain. (G) to (I) cre1 mutant roots inoculated with a gfp-expressing Sm1021 pE65 strain and treated with naringenin (3 µM). (J) to (L) Cross section of a cre1 naringenin-rescued nodule shown in (G) to (I), with gfp-expressing Sm1021 pE65 in infected cells of the nodule. (A), (D), (G), and (J) Bright-field images, (B), (E), (H), and (K) Images taken under GFP excitation (maximum excitation 470 nm; 515-nm long-pass filter) of the same nodules as in (A), (D), (G), and (J). (C), (F), (I), and (L) Overlay of bright-field and fluorescence images from the same row. More than 20 nodule-forming roots were observed under fluorescence for each treatment. White arrowheads in (J) and (L) indicate the nodule peripheral vasculature. Bars = 1 mm in (A) to (I) and 200 µm in (J) to (L).
Figure 9.
Figure 9.
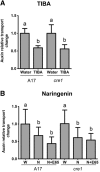
Acropetal Auxin Transport Measurements in Roots of the Wild Type (A17) and cre1 Mutants. Auxin relative transport rate changes at 24 h after treatment are shown. Seedlings were treated with TIBA (A) or naringenin (B), either in the presence or absence of E65. A two-way ANOVA with a Tukey-Kramer multiple comparison post-test was used for statistical analyses (P < 0.05, n = 15 to 25). Different lowercase letters indicate significant differences in relative auxin transport rates. Graphs show mean and sd. W, water; N, naringenin.
Figure 10.
Figure 10.
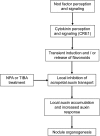
Proposed Model for the Action of Cytokinin on Auxin Transport and Accumulation during Nodule Initiation in M. truncatula. Our data suggest a model in which cytokinin signaling mediated by the CRE1 receptor transiently activates or releases certain flavonoids (most likely naringenin and/or isoliquiritigenin) in the root, which then act as auxin export inhibitors that cause auxin (IAA) accumulation and subsequently enhance auxin response in cells that will divide to form a nodule primordium. Both transient application of synthetic auxin transport inhibitors like NPA and TIBA, or flavonoids, induce (pseudo)nodules infected by rhizobia.

Similar articles

Cited by

References

    1. Allen E.K., Allen O.N., Newman A.S. (1953). Pseudonodulation of leguminous plants induced by 2-bromo-3,5-dichlorobenzoic acid. Am. J. Bot. 40: 429–435.
    1. Ariel F., et al. (2012). Two direct _targets of cytokinin signaling regulate symbiotic nodulation in Medicago truncatula. Plant Cell 24: 3838–3852. - PMC - PubMed
    1. Bailly A., Sovero V., Vincenzetti V., Santelia D., Bartnik D., Koenig B.W., Mancuso S., Martinoia E., Geisler M. (2008). Modulation of P-glycoproteins by auxin transport inhibitors is mediated by interaction with immunophilins. J. Biol. Chem. 283: 21817–21826. - PubMed
    1. Barnett M.J., Toman C.J., Fisher R.F., Long S.R. (2004). A dual-genome Symbiosis Chip for coordinate study of signal exchange and development in a prokaryote-host interaction. Proc. Natl. Acad. Sci. USA 101: 16636–16641. - PMC - PubMed
    1. Benková E., Michniewicz M., Sauer M., Teichmann T., Seifertová D., Jürgens G., Friml J. (2003). Local, efflux-dependent auxin gradients as a common module for plant organ formation. Cell 115: 591–602. - PubMed

Publication types

MeSH terms

LinkOut - more resources

  NODES
Note 1
twitter 2