. 2016 Mar 2:14:15.
doi: 10.1186/s12915-016-0237-6.

The relative importance of kinetic mechanisms and variable enzyme abundances for the regulation of hepatic glucose metabolism--insights from mathematical modeling

Affiliations

The relative importance of kinetic mechanisms and variable enzyme abundances for the regulation of hepatic glucose metabolism--insights from mathematical modeling

Sascha Bulik et al. BMC Biol. .

Abstract

Background: Adaptation of the cellular metabolism to varying external conditions is brought about by regulated changes in the activity of enzymes and transporters. Hormone-dependent reversible enzyme phosphorylation and concentration changes of reactants and allosteric effectors are the major types of rapid kinetic enzyme regulation, whereas on longer time scales changes in protein abundance may also become operative. Here, we used a comprehensive mathematical model of the hepatic glucose metabolism of rat hepatocytes to decipher the relative importance of different regulatory modes and their mutual interdependencies in the hepatic control of plasma glucose homeostasis.

Results: Model simulations reveal significant differences in the capability of liver metabolism to counteract variations of plasma glucose in different physiological settings (starvation, ad libitum nutrient supply, diabetes). Changes in enzyme abundances adjust the metabolic output to the anticipated physiological demand but may turn into a regulatory disadvantage if sudden unexpected changes of the external conditions occur. Allosteric and hormonal control of enzyme activities allow the liver to assume a broad range of metabolic states and may even fully reverse flux changes resulting from changes of enzyme abundances alone. Metabolic control analysis reveals that control of the hepatic glucose metabolism is mainly exerted by enzymes alone, which are differently controlled by alterations in enzyme abundance, reversible phosphorylation, and allosteric effects.

Conclusion: In hepatic glucose metabolism, regulation of enzyme activities by changes of reactants, allosteric effects, and reversible phosphorylation is equally important as changes in protein abundance of key regulatory enzymes.


Figures
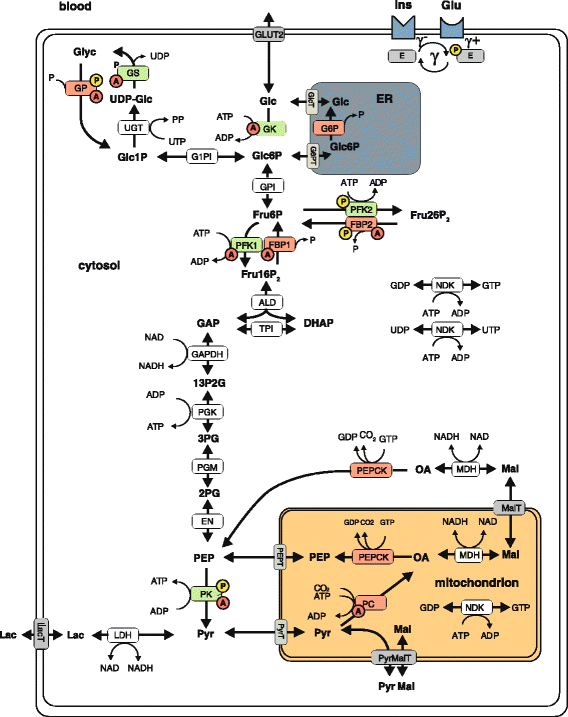
Fig. 1
Fig. 1
Schematic representation of the model of rat hepatocyte carbohydrate metabolism. The model contains enzymes involved in glycolysis, glyconeogenesis, and glycogen synthesis and utilization (ALD, EN, FBP1, FBP2, GAPDH, GK, GP, G6P, GPI, G1PI, GS, LDH, NDK, MDH, PC, PEPCK, PFK1, PFK2, PGK, PGM, PK, TPI, UGT) and transporters (ER < - > cytosol: GlcT, G6PT; mito < - > cytosol: MalT, PEPT, PyrMalT, PyrT; external space < - > cytosol: GLUT2, LacT). Enzymes (E) that are phosphorylated or dephosphorylated (γ) in response to insulin (Ins) and glucagon stimulus are marked by a yellow P, allosteric modification of enzymes is marked by a red A. The model contains the metabolites: DHAP, Fru6P, Fru16P2, Fru26P2, GAP, Glc, Glc1P, Glc6P, Glyc, Lac, Mal, OA, P, PEP, 13P2G, 2PG, 3PG, PP, Pyr, and UDP-Glc. The cofactors NAD, its reduced form NADH, ADP, and ATP are not treated as dynamic variables. GDP and GTP as well as UTP and UDP are generated from ATP and ADP by NDK. The physiological metabolic processes consuming Pyr in the hepatocyte during glycolysis are comprised into Lac formation and export. The rate equations are given in the Additional file 1. ADP, Adenosine diphosphate; ALD, Aldolase; EN, Enolase; ATP, Adenosine triphosphate; DHAP, Dihydroxyacetone phosphate; ER, Endoplasmic reticulum; FBP1, Fructose-1,6-bisphosphatase; FBP2, Fructose-2,6-bisphosphatase; Fru26P2, Fructose 2,6-bisphospate; GAP, Glyceraldehyde 3-phosphate; GAPDH, Glyceraldehyde 3-phosphate dehydrogenase; GDP, Guanosine diphosphate; GK, Glucokinase; GlcT, Glucose transporter; GLUT2, Glucose transporter 2; Glyc, Glycogen; G1PI, Glucose-1-phosphate isomerase; G6P, Glucose-6-phosphate phosphatase; GPI, Glucose-6-phosphate isomerase; GTP, Guanosine triphosphate; LacT, Lactate transporter; LDH, Lactate dehydrogenase; MDH, Malate dehydrogenase; mito, Mitochondrion; NAD, Nicotinamide adenine dinucleotide; NDK, Nucleoside-diphosphate kinase; P, Orthophosphate; PP, Pyrophosphate; Pyr, Pyruvate; PyrMalT, Pyruvate/malate antiporter; PC, Pyruvate carboxylase; PEPCK, Phosphoenolpyruvate carboxykinase; PEPT, Phosphoenolpyruvate transporter; PFK1/2, Phosphofructokinase-1/2; PGK, Phosphoglycerate kinase; PGM, Phosphoglycerate mutase; PK, Pyruvate kinase; PyrT, Pyruvate transporter; TPI, Triose-phosphate isomerase; UDP-Glc, uridine diphosphate glucose; UGT, Uridine diphospho-glucuronosyltransferase; UTP, Uridine triphosphate; 2PG, 2-phosphoglycerate; 3PG, 3-phosphoglycerate; 13P2G, 1,3-bisphosphoglycerate
Fig. 2
Fig. 2
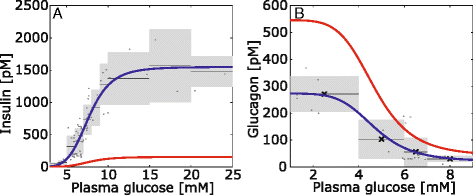
Glucose-hormone-transfer (GHT) functions. The GHT functions describe the dependence of plasma insulin (a) and plasma glucagon (b) on plasma glucose levels. Experimentally determined plasma concentrations of glucose and hormone (grey dots) from various sources (insulin: [–61], glucagon: [, –65]) were pooled (black lines – mean values, light grey boxes – standard deviations). The additional Tables S3 and S4 summarize the used values (Additional file 1). A Hill-type function was used to fit the data by least-square minimization yielding the normal GHT function (blue line). The red line depicts diabetic GHT function. For details of the used fit functions see Additional file 1
Fig. 3
Fig. 3
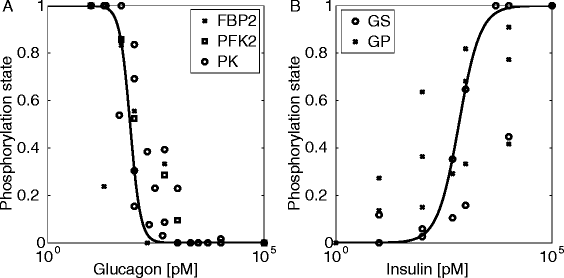
Phosphorylation states of enzymes as function of glucagon (a) or insulin (b) concentrations. Bold lines depict the function γ (Additional file 1) used to relate the level of insulin and glucagon to the phosphorylated form of enzymes regulated by reversible phosphorylation. Experimental data are from various sources [–73]. Additional Tables S5 and S6 summarize the used values (Additional file 1)
Fig. 4
Fig. 4
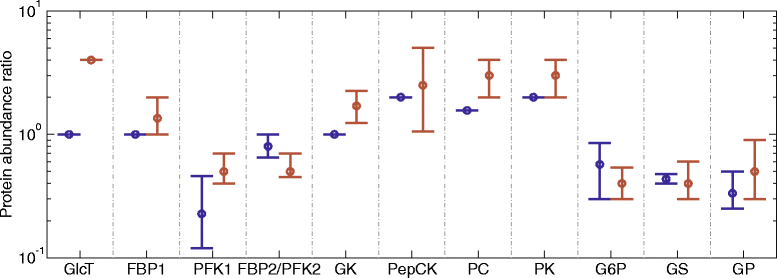
Experimentally determined variations in the abundance of key metabolic enzymes. The circles denote the average ratio between measured protein abundances in hepatocytes from fasted versus fed hepatocytes (blue) and diabetic versus normal hepatocytes (red). Vertical lines indicate the range of reported values. Experimental data are from various sources [, , –38]
Fig. 5
Fig. 5
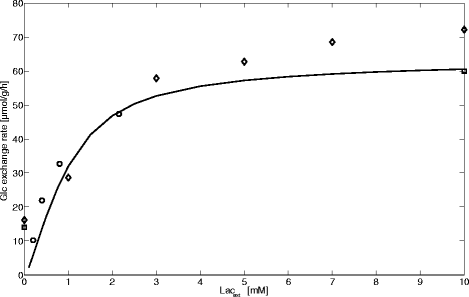
Gluconeogenesis from lactate. The solid line depicts the simulated stationary hepatic glucose exchange flux for fasted hepatocytes as function of the external lactate concentration (Lacext), which was varied between 0–10 mM. Data points represent experimental data taken from [–41] with different shapes for each experiment
Fig. 6
Fig. 6
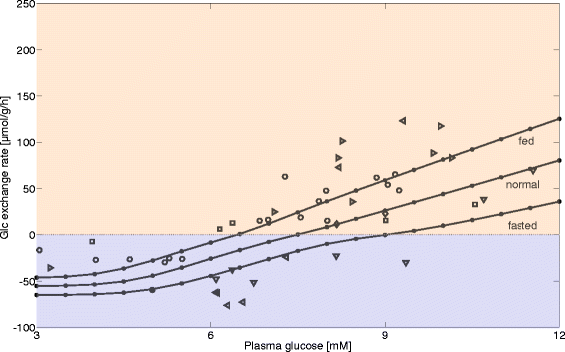
Glucose exchange flux in vivo in dependence of plasma glucose levels. The solid lines depict stationary hepatic glucose exchange rates for fasted, normal, and fed hepatocytes in dependence from the plasma glucose concentration. Data points represent experimental data taken from [, –44] with different shapes for each experiment
Fig. 7
Fig. 7
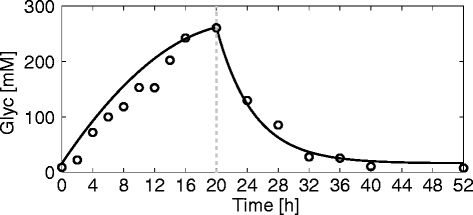
Hepatic glycogen storage. The solid line depicts the time course of intrahepatic glycogen content (Glyc) during refeeding and fasting of initially fasted hepatocytes. Open circles represent experimental data [45], where 48-h fasted rats were fed ad libitum for 20 h before they were fasted again. The broken vertical line indicates the transition from refeeding to fasting conditions
Fig. 8
Fig. 8
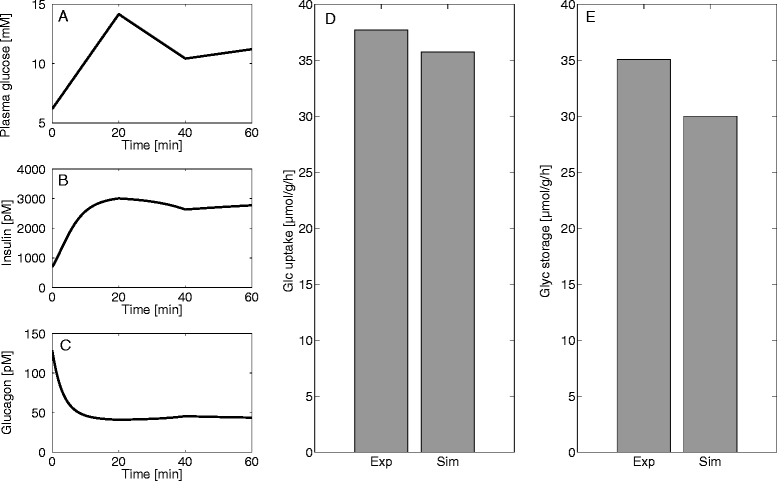
Glycogen production during the first hour of an oral glucose tolerance test. Experimental data (Exp) and the glucose profile (a) used as model input are taken from Niewoehner and Nuttall [6]. Insulin (b) and glucagon concentrations (c) were computed by means of the GHT function (Fig. 2). The bars depict the glucose exchange flux (= net glucose uptake) (d) and the cellular flux of glucose into the glycogen store (e) in units of glucose moieties for the first hour of an oral glucose tolerance test
Fig. 9
Fig. 9
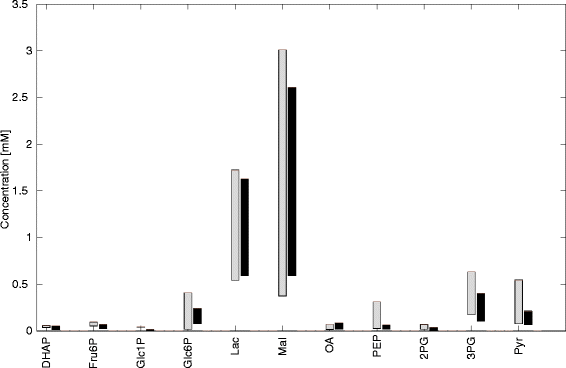
Simulated and measured concentration ranges of metabolites. Experimentally determined concentration ranges of metabolites (gray) are shown together with simulated concentration ranges (black) for the fed, normal, and fasted liver. Simulated concentration ranges were obtained as steady state concentrations when plasma glucose concentration was varied between 3–12 mM with constant plasma lactate (1 mM). Experimental data are from various experimental sources [–54]. Experimental concentration values given in μmol/g wet weight were converted into mM by dividing these by the factor 0.46 and corrected for the liver density of 1.067 g/mL [55]. DHAP, Dihydroxyacetone phosphate; Fru6P, Fructose 6-phosphate; Glc1P, Glucose 1-phosphate; Glc6P, Glucose 6-phosphate; Mal, Malate; OA, Oxaloacetate; PEP, Phosphoenolpyruvate; 2PG, 2-Phosphoglycerate; 3PG, 3-Phosphoglycerate; Pyr, Pyruvate
Fig. 10
Fig. 10
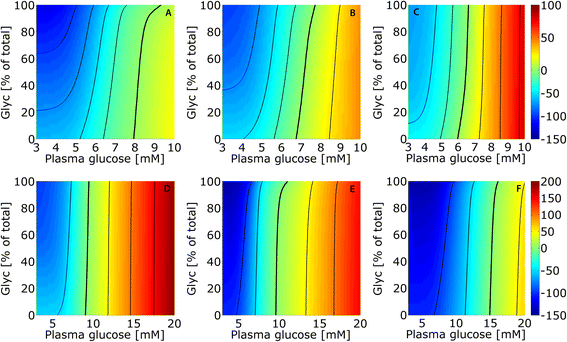
Stationary glucose exchange fluxes in dependence of plasma glucose and glycogen store. Plasma glucose was varied between 3 and 10 mM and filling state of glycogen storage was variably fixed to values between 0 and 100 %. The color encodes the steady state flux rates of glucose exchange of fasted (a), normal (b), fed (c), and diabetic hepatocytes (df). Green colors indicate small values of the glucose exchange flux around the set point where the net glucose exchange is zero (marked by bold black lines). Warm colors indicate net glucose uptake and cool colors indicate net glucose release. The legend is given on the right-hand axis in units of μmol/h/g tissue. Thin black isoclines connect equal exchange fluxes (in steps of 25 μmol/h/g tissue). Note that the set point values at 6.5 mM (fed), 7.5 mM (normal), and 9 mM (fasted) at half-filling of the glycogen store are identical with those in Fig. 6, where the glycogen contribution is zero due to the condition of stationarity. For the diabetic liver, the calculations were performed for three different scenarios: (d) no change of enzyme abundances compared with the normal state but impaired glucose-hormone relationship (see red curves of the GHT function in Fig. 2); (e) altered protein abundances (see Table 1 for scaling factors) but normal GHT function; and (f) combined effect of altered glucose-hormone relationship and protein abundances
Fig. 11
Fig. 11
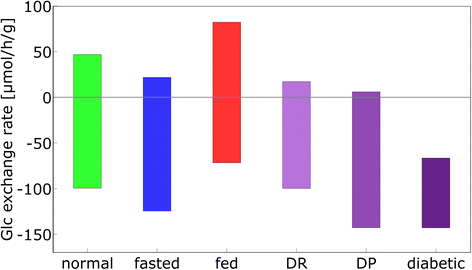
Maximal ranges of the glucose exchange fluxes. Plasma glucose was varied between 3 and 10 mM. Normal: protein abundance of normal hepatocytes; fasted: protein abundance of fasted hepatocytes; fed: protein abundance of fed hepatocytes; DR: diabetic GHT function, protein abundance of normal hepatocytes; DP: protein abundance of diabetic hepatocytes; diabetic: diabetic GHT function and protein abundance of diabetic hepatocytes
Fig. 12
Fig. 12
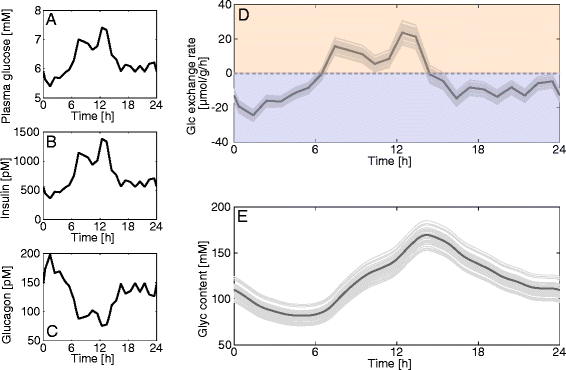
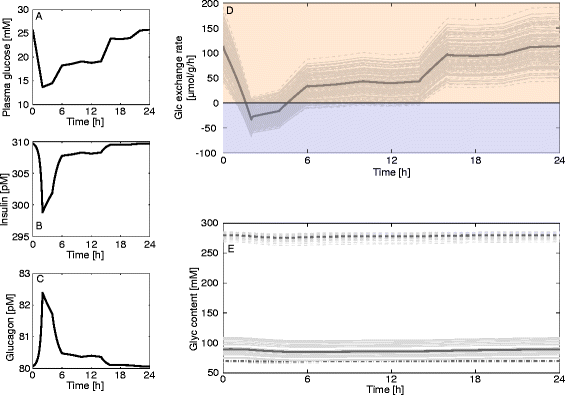
Diurnal variations of the glucose exchange flux and glycogen in the fed state. (a) Measured diurnal profiles of plasma glucose for fed hepatocytes taken from [56] and used as model input. (b, c) Diurnal profiles of insulin and glucagon calculated from the plasma glucose profile in (a) by means of the GHT function. (d) Simulated diurnal glucose exchange flux. (e) Simulated diurnal glycogen content in fed hepatocytes. The simulation was repeated 50 times with uniformly sampled protein abundances from the observed range for each enzyme (Table 1)
Fig. 13
Fig. 13
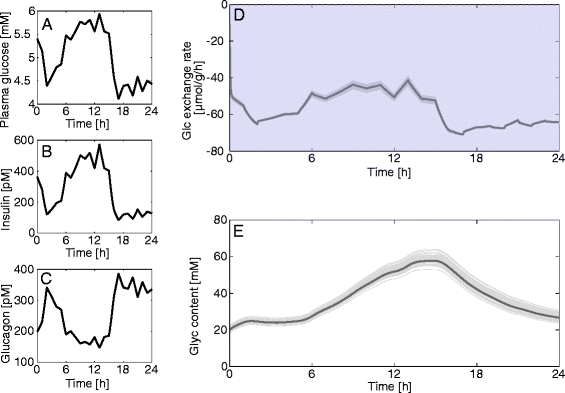
Diurnal variations of the glucose exchange flux and glycogen in the fasted state. (a) Measured diurnal profiles of plasma glucose for fasted hepatocytes taken from [56] and used as model input. (b, c) Diurnal profiles of insulin and glucagon calculated from the plasma glucose profile in (a) by means of the GHT function. (d) Simulated diurnal glucose exchange flux. (e) Simulated diurnal glycogen content in fasted hepatocytes. The simulation was repeated 50 times with uniformly sampled protein abundances from the observed range for each enzyme (Table 1)
Fig. 14
Fig. 14
Diurnal variations of HGP/HGU and glycogen in the diabetic state. (a) Measured diurnal profiles of plasma glucose for diabetic hepatocytes taken from [8] and used as model input. (b, c) Diurnal profiles of insulin and glucagon calculated from the plasma glucose profile in (a) by means of the GHT function (Fig. 2, red curve). (d) Simulated diurnal glucose exchange flux. (e) Simulated diurnal glycogen content in diabetic hepatocytes. The simulation was repeated 50 times with uniformly sampled protein abundances from the observed range for each enzyme (Table 1). Due to conflicting experimental data regarding the amount of glycogen synthase (GS) and glycogen phosphorylase (GP) in diabetic hepatocytes, we set up three different scenarios: increased activity of GS by 70 % and diminished activity of GP by 50 % [29] (top trace – solid line); increased activity of GS by 70 % and decreased activity of GP by 50 % and reduced total glycogen storage capacity to 75 % [57] (bottom trace – dashed line); and decreased GS activity by 50 % and unchanged GP activity [58] (middle trace – dash-dotted line)
Fig. 15
Fig. 15
Different capabilities of fasted and fed hepatocytes to cope with transient hyperglycemic conditions. The figure depicts glucose exchange flux (b) and glycogen content (c) of fasted (blue), normal (green), and fed (red) hepatocytes in response to the 24-h glucose profile of fasted rats (a). The dotted lines refer to a situation where a transient glucose bolus (between 12 and 16 h) was added, driving the plasma glucose to a peak value of 10 mM. While the fasted hepatocyte has the highest glucose release rates in the unperturbed case it is clearly less efficient than the normal and fed hepatocyte to take up large amounts of glucose under sudden hyperglycemic conditions
Fig. 16
Fig. 16
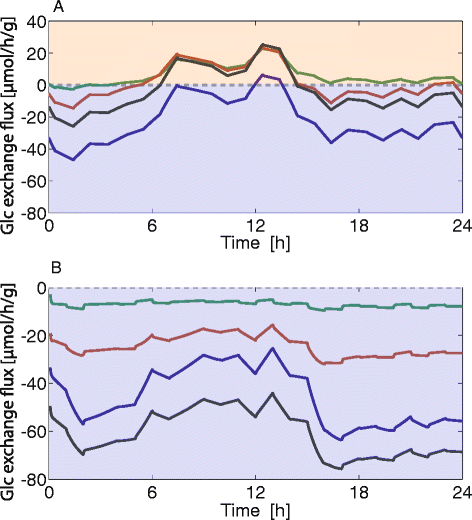
Influence of different levels of metabolic control on diurnal glucose exchange rates. Black curves: Full control – enzyme abundances are adapted to the fed (a) and fasted (b) state (Table 1) with full allosteric and hormonal control. Blue curves: No change of enzyme abundance – enzyme abundances of fed and fasted livers are the same as in the normal liver; full allosteric and hormonal control. Green curves: Lacking hormonal control – enzyme abundances are adapted to the fed (a) and fasted (b) state with full allosteric control. The value of the function γ controlling the ration between the phosphorylated and non-phosphorylated form of all enzymes is put to the constant value of 0.32, which holds at the reference case (= set point of the normal hepatocyte). Red curves: No allosteric regulation – enzyme abundances were adapted to the fed (a) and fasted (b) state, with full hormonal control. The saturation terms for allosteric effectors in the enzymatic rate equations were fixed to the values achieved in the reference state
Fig. 17
Fig. 17
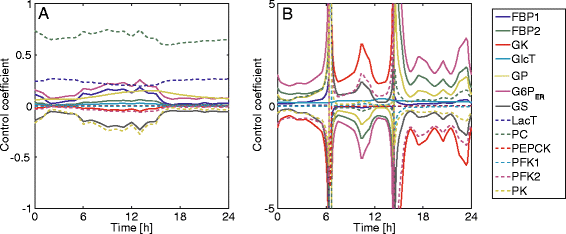
Control coefficients of regulatory enzymes. The control coefficients of the key regulatory enzymes are shown for the diurnal glucose profiles of the fasted (a) and fed (b) liver (see Figs. 12 and 13)
Fig. 18
Fig. 18
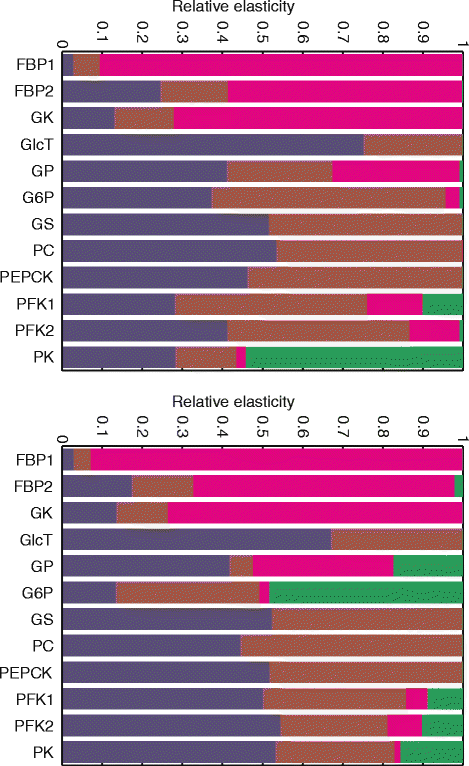
Relative enzyme π-elasticity coefficients. The π-elasticity coefficients (defined in Equation 4) with respect to protein abundance (blue), reactants (brown), allosteric effectors (pink), and reversible phosphorylation (green) for fasted hepatocytes at 4 mM plasma glucose (a) and fed hepatocytes at 10 mM plasma glucose (b). The elasticity coefficients for each enzyme were normalized to their absolute sum. For the reference flux values see legend of Table 3

Similar articles

Cited by

References

    1. Hopgood MF, Ballard FJ. Synthesis and degradation of phosphoenolpyruvate carboxylase in rat liver and adipose tissue. Changes during a starvation-re-feeding cycle. Biochem J. 1973;134(2):445–453. doi: 10.1042/bj1340445. - DOI - PMC - PubMed
    1. Weinberg MB, Utter MF. Effect of streptozotocin-induced diabetes mellitus on the turnover of rat liver pyruvate carboxylase and pyruvate dehydrogenase. Biochem J. 1980;188(3):601–608. doi: 10.1042/bj1880601. - DOI - PMC - PubMed
    1. ter Kuile BH, Westerhoff HV. Transcriptome meets metabolome: hierarchical and metabolic regulation of the glycolytic pathway. FEBS Lett. 2001;500(3):169–171. doi: 10.1016/S0014-5793(01)02613-8. - DOI - PubMed
    1. Vogt AM, Poolman M, Ackermann C, Yildiz M, Schoels W, Fell DA, et al. Regulation of glycolytic flux in ischemic preconditioning. A study employing metabolic control analysis. J Biol Chem. 2002;277(27):24411–24419. doi: 10.1074/jbc.M201138200. - DOI - PubMed
    1. Bruggeman FJ, de Haan J, Hardin H, Bouwman J, Rossell S, van Eunen K, et al. Time-dependent hierarchical regulation analysis: deciphering cellular adaptation. Syst Biol (Stevenage) 2006;153(5):318–322. doi: 10.1049/ip-syb:20060027. - DOI - PubMed

Publication types

LinkOut - more resources

  NODES
Note 3
twitter 2