Canopy position has a profound effect on soybean seed composition
- PMID: 27672507
- PMCID: PMC5028787
- DOI: 10.7717/peerj.2452
Canopy position has a profound effect on soybean seed composition
Abstract
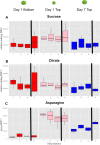
Although soybean seeds appear homogeneous, their composition (protein, oil and mineral concentrations) can vary significantly with the canopy position where they were produced. In studies with 10 cultivars grown over a 3-yr period, we found that seeds produced at the top of the canopy have higher concentrations of protein but less oil and lower concentrations of minerals such as Mg, Fe, and Cu compared to seeds produced at the bottom of the canopy. Among cultivars, mean protein concentration (average of different positions) correlated positively with mean concentrations of S, Zn and Fe, but not other minerals. Therefore, on a whole plant basis, the uptake and allocation of S, Zn and Fe to seeds correlated with the production and allocation of reduced N to seed protein; however, the reduced N and correlated minerals (S, Zn and Fe) showed different patterns of allocation among node positions. For example, while mean concentrations of protein and Fe correlated positively, the two parameters correlated negatively in terms of variation with canopy position. Altering the microenvironment within the soybean canopy by removing neighboring plants at flowering increased protein concentration in particular at lower node positions and thus altered the node-position gradient in protein (and oil) without altering the distribution of Mg, Fe and Cu, suggesting different underlying control mechanisms. Metabolomic analysis of developing seeds at different positions in the canopy suggests that availability of free asparagine may be a positive determinant of storage protein accumulation in seeds and may explain the increased protein accumulation in seeds produced at the top of the canopy. Our results establish node-position variation in seed constituents and provide a new experimental system to identify genes controlling key aspects of seed composition. In addition, our results provide an unexpected and simple approach to link agronomic practices to improve human nutrition and health in developing countries because food products produced from seeds at the bottom of the canopy contained higher Fe concentrations than products from the top of the canopy. Therefore, using seeds produced in the lower canopy for production of iron-rich soy foods for human consumption could be important when plants are the major source of protein and human diets can be chronically deficient in Fe and other minerals.
Keywords: Canopy; Elemental composition; Ionome; Nutrition; Physiology; Soybean.
Conflict of interest statement
The authors declare there are no competing interests.
Figures





Similar articles
-
Increased temperatures may safeguard the nutritional quality of crops under future elevated CO2 concentrations.Plant J. 2019 Mar;97(5):872-886. doi: 10.1111/tpj.14166. Epub 2019 Jan 18. Plant J. 2019. PMID: 30447177 Free PMC article.
-
Vertical Canopy Profile and the Impact of Branches on Soybean Seed Composition.Front Plant Sci. 2021 Sep 8;12:725767. doi: 10.3389/fpls.2021.725767. eCollection 2021. Front Plant Sci. 2021. PMID: 34567040 Free PMC article.
-
Soybean seed physiology, quality, and chemical composition under soil moisture stress.Food Chem. 2019 Apr 25;278:92-100. doi: 10.1016/j.foodchem.2018.11.035. Epub 2018 Nov 7. Food Chem. 2019. PMID: 30583452
-
Evaluation of constitutive iron reductase (AtFRO2) expression on mineral accumulation and distribution in soybean (Glycine max. L).Front Plant Sci. 2014 Apr 3;5:112. doi: 10.3389/fpls.2014.00112. eCollection 2014. Front Plant Sci. 2014. PMID: 24765096 Free PMC article.
-
Handing off iron to the next generation: how does it get into seeds and what for?Biochem J. 2020 Jan 17;477(1):259-274. doi: 10.1042/BCJ20190188. Biochem J. 2020. PMID: 31950999 Review.
Cited by
-
Soybean seed yield, protein, and oil concentration for a modern and old genotype under varying row spacings.Heliyon. 2024 Jul 25;10(15):e35054. doi: 10.1016/j.heliyon.2024.e35054. eCollection 2024 Aug 15. Heliyon. 2024. PMID: 39161827 Free PMC article.
-
Rootstock effects on scion phenotypes in a 'Chambourcin' experimental vineyard.Hortic Res. 2019 May 1;6:64. doi: 10.1038/s41438-019-0146-2. eCollection 2019. Hortic Res. 2019. PMID: 31069086 Free PMC article.
-
Spatial Characterization of Soybean Yield and Quality (Amino Acids, Oil, and Protein) for United States.Sci Rep. 2018 Oct 2;8(1):14653. doi: 10.1038/s41598-018-32895-0. Sci Rep. 2018. PMID: 30279447 Free PMC article.
-
Multivariate Analysis of the Cotton Seed Ionome Reveals a Shared Genetic Architecture.G3 (Bethesda). 2018 Mar 28;8(4):1147-1160. doi: 10.1534/g3.117.300479. G3 (Bethesda). 2018. PMID: 29437829 Free PMC article.
-
Temporal and environmental factors interact with rootstock genotype to shape leaf elemental composition in grafted grapevines.Plant Direct. 2022 Aug 19;6(8):e440. doi: 10.1002/pld3.440. eCollection 2022 Aug. Plant Direct. 2022. PMID: 35999957 Free PMC article.
References
-
- Baldocchi DD, Verma SB, Rosenberg NJ. Microclimate in the soybean canopy. Agricultural Meteorology. 1983;28:321–337. doi: 10.1016/0002-1571(83)90009-2. - DOI
-
- Carrera C, Martínez MJ, Dardanelli J, Balzarini M. Water deficit effect on the relationship between temperature during the seed fill period and soybean seed oil and protein concentrations. Crop Science. 2009;49:990–998. doi: 10.2135/cropsci2008.06.0361. - DOI
-
- Carrera C, Martínez MJ, Dardanelli J, Balzarini M. Environmental variation and correlation of seed components in nontransgenic soybeans: protein, oil, unsaturated fatty acids, tocopherols, and isoflavones. Crop Science. 2011;51:800–809. doi: 10.2135/cropsci2010.06.0314. - DOI
Grants and funding
LinkOut - more resources
Full Text Sources
Other Literature Sources

