. 2016 Nov;34(11):1180-1190.
doi: 10.1038/nbt.3678. Epub 2016 Oct 3.

Genome-scale high-resolution mapping of activating and repressive nucleotides in regulatory regions

Affiliations

Genome-scale high-resolution mapping of activating and repressive nucleotides in regulatory regions

Jason Ernst et al. Nat Biotechnol. 2016 Nov.

Abstract

Massively parallel reporter assays (MPRAs) enable nucleotide-resolution dissection of transcriptional regulatory regions, such as enhancers, but only few regions at a time. Here we present a combined experimental and computational approach, Systematic high-resolution activation and repression profiling with reporter tiling using MPRA (Sharpr-MPRA), that allows high-resolution analysis of thousands of regions simultaneously. Sharpr-MPRA combines dense tiling of overlapping MPRA constructs with a probabilistic graphical model to recognize functional regulatory nucleotides, and to distinguish activating and repressive nucleotides, using their inferred contribution to reporter gene expression. We used Sharpr-MPRA to test 4.6 million nucleotides spanning 15,000 putative regulatory regions tiled at 5-nucleotide resolution in two human cell types. Our results recovered known cell-type-specific regulatory motifs and evolutionarily conserved nucleotides, and distinguished known activating and repressive motifs. Our results also showed that endogenous chromatin state and DNA accessibility are both predictive of regulatory function in reporter assays, identified retroviral elements with activating roles, and uncovered 'attenuator' motifs with repressive roles in active chromatin.


Figures

Figure 1
Figure 1. Experimental Design
(a) Comparison of MPRA strategies for testing regulatory regions. Non-tiling approaches (top, e.g. Ref.) use multiple barcodes for the same tested sequence. Our pilot design (middle) tests each region using 9 tile offsets, spaced at 30-bp increments, each tested using 24 barcodes (216 MPRA array spots per region). Our scaled-up design (bottom), tests each region using 31 tile offsets spaced at 5-bp increments, each tested using a single barcode per tile offset. The designs are to scale along the horizontal dimension. Only top and bottom are to scale in the vertical dimension. (b) The 25 chromatin states used in selecting regulatory regions for testing in the scale-up design, (Supplementary Fig. 5). Heatmap indicates the emission probabilities (scaled between 0 and 100) for each epigenomic feature (columns) in each chromatin state (rows). Tested regions were restricted to DNase sites in one of four cell types, with the number of regions selected based on a stratified random sampling as indicated. (c) Overview of experiments using the scale-up design (see Supplementary Fig. 1 for the pilot design). We carried out 16 experiments, consisting of two sets of 7860 regions (row groups) across 25 chromatin states (colors), with 31 tiles per region (individual columns), each tested in both HepG2 (orange) and K562 (green), each using both a minimal promoter and an SV40 promoter, each in two replicates. Heatmap shows MPRA reporter gene expression measurements (blue=low, yellow=high, black=missing) (Supplementary Data 3).
Figure 2
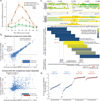
Figure 2. Tiling enhancer regions in pilot design reveals regulatory segments at 30-bp resolution
(a) Effect of tile offset and H3K27ac dip score on reporter expression. Average HepG2 reporter expression (y-axis) at each of nine offsets (x-axis) for three sets of regions (color): HepG2 candidate enhancers with the highest H3K27ac dip scores (orange), candidate enhancers with a range of dip scores (light orange), and regions that are not predicted enhancers in HepG2 but are predicted enhancers with a high dip score in K562 (green). Error bar height is one standard error. (b) Consecutive tiles can differ in reporter expression. Top: Comparison of median reporter activity between biological replicates in HepG2. Only first eight tile offsets shown. Bottom: Comparison of consecutive tiles T (x-axis) and T+1 (y-axis) for the same biological replicate (rep1). (c) Top: Chromatin state annotations in nine cell types and H3K27ac signal track in HepG2 over the 500kb and 10kb surrounding the tiled 385-bp region centered in the H3K27ac dip. Middle: Expanded view of tile reporter measurements (yellow blue color) across all nine tiles, 24 barcodes, and two replicates. Bottom: Tiles #4 and #5 share 115-bp in common (abbreviated), and have 30-bp unique to #4 or #5 (shown), indicating the potential presence of activating elements in the sequence unique to #5 and/or repressive elements in the sequence unique to #4. Indeed, the 30-bp segment unique to #5 contains a candidate binding site for HNF4, a known activator of liver-related functions. (d) Expanded view of expression activity measurements for consecutive tiles #4 and #5 for all individual barcodes (points), sorted by their reporter expression levels. For Replicate 1 of Tile #4, 1 of 24 barcode measurements failed. The y-axis coordinates correspond to the ones shown in panel b. See Supplementary Figs. 2–4 for additional results on the pilot design.
Figure 3
Figure 3. Scale-up design permits dissection of regulatory elements at high-resolution
(a) Modeling scheme and probabilistic graphical model for the scale-up design. Variables M1,…,M31 represent the observed values of the reporter measurements for the 31 tiles (each 145-bp long), and variables A1,…,A59 represent the unobserved regulatory activity level of each 5-bp interval of the 295-bp covered, which is then normalized into the Sharpr-MPRA regulatory activity score. Bottom: Probabilistic graphical model used for high-resolution inference of activating and repressive intervals, with arrows AkMj illustrating the dependencies between variables when tile Mj overlaps interval Ak, and the direction of information flow in the generative model. Conditional inference allows us to use the observed reporter measurements M1,…,M31 for each tile j in order to infer the unobserved activity levels A1,…,A59 for each 5-bp interval k, which we interpolate to each nucleotide position i, under the modeling assumptions specified in Methods. (b) Observed reporter expression measurements for 145-bp segments (top) and inferred regulatory activity for 5-bp segments, interpolated to individual nucleotides (bottom) for two 295-bp regulatory regions in HepG2 cells. Top: At each offset, the four rows correspond to four measurements of the same tile, using the minP and SV40P promoter, each in two replicates. Measurements for each tile are shown spanning all nucleotide positions the tile covers. White rows represent missing data for a promoter/replicate combination for a given 145-bp tile. Bottom: resulting inference of regulatory activity at each nucleotide i using all four measurements (black), only the two SV40P measurements (green), or only the two minP measurements (blue). Predicted positions of highest activating (positive scores) or repressive (negative scores) activity capture CENTIPEDE predicted binding sites (red boxes) and conserved elements identified by the SiPhy-PI method, (purple boxes), even though such information was not used in our inferences. These examples are shown (and boxed) on page 2 of Supplementary Data Files 6a and 6b respectively. (c) Higher activating or repressive Sharpr-MPRA regulation activity score in HepG2 cells (x-axis) results in higher overlap with transcription factor binding sites predicted by CENTIPEDE in HepG2 cells (y-axis, left panel), and higher overlap with conserved elements identified by SiPhy-PI, (y-axis, right panel). Each point represents the average of 927 nucleotide positions in each of 5,000 quantiles. Horizontal black line shows the expected overlap averaged across all 295 nucleotide positions of each region, and the green line shows the expected overlap fraction at the center nucleotide position (a stringent control). Reversed grey barplot at the top of each panel shows the density (histogram) of the distribution of Sharpr-MPRA combinedP scores in HepG2 cells. (d) Sharpr-MPRA inferences capture regulatory nucleotides at high resolution. Cumulative overlap (y-axis) with CENTIPEDE predicted transcription factor binding sites in HepG2 (left plot) and evolutionarily conserved elements (right plot) is higher for maximum-absolutely-score nucleotide positions (MaxPos, blue), than for the stringent control of DNase center nucleotide positions (CenPos, red), or for symmetric nucleotide positions (SymPos, green), indicating this is not a positional bias. Each set is ranked from highest (left) to lowest (right) absolute Sharpr-MPRA score in MaxPos/CenPos/SymPos nucleotides (x-axis) in HepG2 cells (see Supplementary Fig. 21 for K562 cells, and for individual promoter types). Dotted lines mark thresholds at absolute score ≥2, ≥1, and ≥0.5. MaxPos, CenPos, and SymPos nucleotide positions are illustrated in the example of panel b.
Figure 4
Figure 4. Comparison of Sharpr-MPRA with motif annotations
(a) Comparison of average Sharpr-MPRA score for regulatory motifs from a previously assembled compendium (points) in HepG2 (x-axis) vs. K562 (y-axis), averaged at the center position of all instances for each motif. Arrows highlight motif examples mentioned in the text (Supplementary Table 2). Only motifs with more than 10 instances are shown. (b) Aggregation plots of the regulation score (y-axis) at increasing varying genomic positions relative to the motif center (x-axis) for K562 (green) and HepG2 (orange) for all motif instances, predicted independently of cell type in Ref , for ETS_known9, GATA_known14, REST_known2, HNF4_known18, and RFX5_known6 regulatory motifs. Error bar height is one standard error. (c) Activating enrichment score (y-axis) and repressive enrichment score (x-axis) for the regulatory motif compendium (points) in HepG2 (left) and K562 (right), based on the statistical significance (−log10P) for the enrichment of the center motif position for nucleotides with Sharpr-MPRA scores ≤−1 (repressive) or ≥1 (activating), using a one-sided binomial test. Inset expands boxed region, and does not cover any points, as no motif was enriched beyond −log10P=20 for both activating and repressing positions. Arrows highlight members of MAF and AP-2 motif families discussed in text. Similar plots using top 5% activating and repressive nucleotides in Supplementary Fig. 29.
Figure 5
Figure 5. Regulatory activity of ERV1 and LINE repeats
For nucleotides of varying Sharpr-MPRA regulatory activity score in HepG2 cells (x-axis bins) the fraction that overlaps with annotated repeat elements (y-axis) shows a strong ERV1 repeat enrichment at the most activating nucleotides (panel a) and a depletion for LINE repeats at the most activating and most repressive nucleotides (panel b). Bins formed by assigning each base to the nearest 0.5 value based on its regulatory score. Extreme bins contain extreme values as indicated. Horizontal lines denote expected overlap based on center position (CenPos, green), and all positions (black). Enrichments and depletions for K562 and for additional repeats shown in Supplementary Fig. 30.
Figure 6
Figure 6. Endogenous chromatin state is predictive of reporter activity
(a,b) Average HepG2 Sharpr-MPRA regulatory score (y-axis) and standard error (vertical error bars) for each chromatin state (columns) for (a) all 3930 DNase regions selected in HepG2 and (b) all 15,720 regions selected in all four cell types, evaluated at nucleotide positions of maximum absolute activity (MaxPos). In panel a, each group of consecutive bars shows the combinedP, minP, and SV40P results. All 3930 regions correspond to DNase sites in HepG2, as they were selected in HepG2. In panel b, the combinedP score is shown separately for regions corresponding to DNase sites in HepG2 (light shading) and non-DNase sites in HepG2 (darker shading). Some DNase sites selected in other cell types were also DNase in HepG2, leading to an increased DNase count compared to panel a. All non-DNase regions in HepG2 were DNase regions in the cell type in which they were selected. The chromatin state of the center position is shown. K562 plots in Supplementary Fig. 31. (c) For all motifs (Ref 13) (circles) in HepG2-selected regions (top) and K562-selected regions (bottom), relationship between their average combinedP Sharpr-MPRA score in the corresponding cell type (y-axis) and their expected score based on the chromatin states in which the motif occurs (x-axis), quantified as the median of randomized motif occurrences that preserve positional and chromatin state distributions (see Methods). Only motifs with 20 or more evaluated instances in selected regions are shown. Diagonal line shows y=x line. Randomization 95th percentile confidence intervals shown in Supplementary Fig. 39.

Similar articles

Cited by

References

    1. ENCODE Project Consortium et al. An integrated encyclopedia of DNA elements in the human genome. Nature. 2012;489:57–74. - PMC - PubMed
    1. Ernst J, et al. Mapping and analysis of chromatin state dynamics in nine human cell types. Nature. 2011;473:43–49. - PMC - PubMed
    1. Heintzman ND, et al. Histone modifications at human enhancers reflect global cell-type-specific gene expression. Nature. 2009;459:108–112. - PMC - PubMed
    1. Roadmap Epigenomics Consortium et al. Integrative analysis of 111 reference human epigenomes. Nature. 2015;518:317–330. - PMC - PubMed
    1. Boyle AP, et al. High-resolution genome-wide in vivo footprinting of diverse transcription factors in human cells. Genome Res. 2011;21:456–464. - PMC - PubMed

MeSH terms

  NODES
Note 1
Project 2
twitter 2