Human Innate Lymphoid Cell Subsets Possess Tissue-Type Based Heterogeneity in Phenotype and Frequency
- PMID: 27986455
- PMCID: PMC7612935
- DOI: 10.1016/j.immuni.2016.11.005
Human Innate Lymphoid Cell Subsets Possess Tissue-Type Based Heterogeneity in Phenotype and Frequency
Erratum in
-
Human Innate Lymphoid Cell Subsets Possess Tissue-Type Based Heterogeneity in Phenotype and Frequency.Immunity. 2018 May 15;48(5):1060. doi: 10.1016/j.immuni.2018.04.028. Immunity. 2018. PMID: 29768165 No abstract available.
Abstract
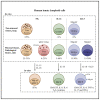
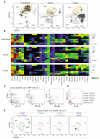
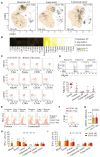
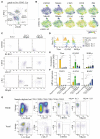
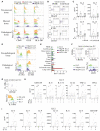
Animal models have highlighted the importance of innate lymphoid cells (ILCs) in multiple immune responses. However, technical limitations have hampered adequate characterization of ILCs in humans. Here, we used mass cytometry including a broad range of surface markers and transcription factors to accurately identify and profile ILCs across healthy and inflamed tissue types. High dimensional analysis allowed for clear phenotypic delineation of ILC2 and ILC3 subsets. We were not able to detect ILC1 cells in any of the tissues assessed, however, we identified intra-epithelial (ie)ILC1-like cells that represent a broader category of NK cells in mucosal and non-mucosal pathological tissues. In addition, we have revealed the expression of phenotypic molecules that have not been previously described for ILCs. Our analysis shows that human ILCs are highly heterogeneous cell types between individuals and tissues. It also provides a global, comprehensive, and detailed description of ILC heterogeneity in humans across patients and tissues.
Keywords: CyTOF; ILC; ILC1; ILC2; ILC3; human; ieILC1.
Copyright © 2017 Elsevier Inc. All rights reserved.
Figures


Comment in
-
How Many Subsets of Innate Lymphoid Cells Do We Need?Immunity. 2017 Jan 17;46(1):10-13. doi: 10.1016/j.immuni.2016.12.018. Immunity. 2017. PMID: 28099859
-
Human ILC1: To Be or Not to Be.Immunity. 2017 May 16;46(5):756-757. doi: 10.1016/j.immuni.2017.05.001. Immunity. 2017. PMID: 28514676 Free PMC article. No abstract available.
-
Human Group 1 Innate Lymphocytes Are Negative for Surface CD3ε but Express CD5.Immunity. 2017 May 16;46(5):758-759. doi: 10.1016/j.immuni.2017.04.024. Immunity. 2017. PMID: 28514677 Free PMC article.
-
Toward Meaningful Definitions of Innate-Lymphoid-Cell Subsets.Immunity. 2017 May 16;46(5):760-761. doi: 10.1016/j.immuni.2017.04.026. Immunity. 2017. PMID: 28514678 No abstract available.
Similar articles
-
Dissecting human ILC heterogeneity: more than just three subsets.Immunology. 2018 Mar;153(3):297-303. doi: 10.1111/imm.12862. Epub 2017 Dec 26. Immunology. 2018. PMID: 29140572 Free PMC article. Review.
-
Peripheral Innate Lymphoid Cells Are Increased in First Line Metastatic Colorectal Carcinoma Patients: A Negative Correlation With Th1 Immune Responses.Front Immunol. 2019 Sep 6;10:2121. doi: 10.3389/fimmu.2019.02121. eCollection 2019. Front Immunol. 2019. PMID: 31555301 Free PMC article. Clinical Trial.
-
Characterization of Rat ILCs Reveals ILC2 as the Dominant Intestinal Subset.Front Immunol. 2020 Feb 19;11:255. doi: 10.3389/fimmu.2020.00255. eCollection 2020. Front Immunol. 2020. PMID: 32140157 Free PMC article.
-
Isolation and characterization of mouse innate lymphoid cells.Curr Protoc Immunol. 2014 Aug 1;106:3.25.1-3.25.13. doi: 10.1002/0471142735.im0325s106. Curr Protoc Immunol. 2014. PMID: 25081911 Review.
-
CPHEN-15: Comprehensive phenotyping of human peripheral blood helper-ILCs by flow cytometry.Cytometry A. 2023 May;103(5):378-382. doi: 10.1002/cyto.a.24717. Epub 2023 Jan 28. Cytometry A. 2023. PMID: 36708139 Review.
Cited by
-
Innate lymphoid cells in early tumor development.Front Immunol. 2022 Aug 12;13:948358. doi: 10.3389/fimmu.2022.948358. eCollection 2022. Front Immunol. 2022. PMID: 36032129 Free PMC article. Review.
-
Lymphoid Tissue inducer (LTi) cell ontogeny and functioning in embryo and adult.Biomed J. 2021 Apr;44(2):123-132. doi: 10.1016/j.bj.2020.12.003. Epub 2020 Dec 10. Biomed J. 2021. PMID: 33849806 Free PMC article. Review.
-
Mass cytometry-based peripheral blood analysis as a novel tool for early detection of solid tumours: a multicentre study.Gut. 2023 May;72(5):996-1006. doi: 10.1136/gutjnl-2022-327496. Epub 2022 Sep 16. Gut. 2023. PMID: 36113977 Free PMC article.
-
Regulation of Human Innate Lymphoid Cells in the Context of Mucosal Inflammation.Front Immunol. 2020 Jun 23;11:1062. doi: 10.3389/fimmu.2020.01062. eCollection 2020. Front Immunol. 2020. PMID: 32655549 Free PMC article. Review.
-
IFNγ-producing NK cells in adipose tissue are associated with hyperglycemia and insulin resistance in obese women.Int J Obes (Lond). 2021 Jul;45(7):1607-1617. doi: 10.1038/s41366-021-00826-1. Epub 2021 May 1. Int J Obes (Lond). 2021. PMID: 33934108
References
-
- Artis D, Spits H. The biology of innate lymphoid cells. Nature. 2015;517:293–301. - PubMed
-
- Bernink JH, Peters CP, Munneke M, te Velde AA, Meijer SL, Weijer K, Hreggvidsdottir HS, Heinsbroek SE, Legrand N, Buskens CJ, et al. Human type 1 innate lymphoid cells accumulate in inflamed mucosal tissues. Nat Immunol. 2013;14:221–229. - PubMed
-
- Bernink JH, Krabbendam L, Germar K, de Jong E, Gronke K, Kofoed-Nielsen M, Munneke JM, Hazenberg MD, Villaudy J, Buskens CJ, et al. Interleukin-12 and -23 Control Plasticity of CD127(+) Group 1 and Group 3 Innate Lymphoid Cells in the Intestinal Lamina Propria. Immunity. 2015;43:146–160. - PubMed
-
- Björklund AK, Forkel M, Picelli S, Konya V, Theorell J, Friberg D, Sandberg R, Mjösberg J. The heterogeneity of human CD127(+) innate lymphoid cells revealed by single-cell RNA sequencing. Nat Immunol. 2016;17:451–460. - PubMed
-
- Boyman O, Sprent J. The role of interleukin-2 during homeostasis and activation of the immune system. Nat Rev Immunol. 2012;12:180–190. - PubMed
Publication types
MeSH terms
Grants and funding
LinkOut - more resources
Full Text Sources
Other Literature Sources

