In vivo and ex vivo cetuximab sensitivity assay using three-dimensional primary culture system to stratify KRAS mutant colorectal cancer
- PMID: 28301591
- PMCID: PMC5354432
- DOI: 10.1371/journal.pone.0174151
In vivo and ex vivo cetuximab sensitivity assay using three-dimensional primary culture system to stratify KRAS mutant colorectal cancer
Abstract
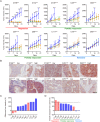
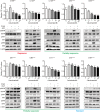
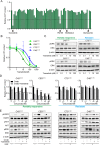
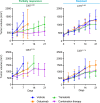
In clinic, cetuximab, an anti-EGFR antibody, improves treatment outcomes in colorectal cancer (CRC). KRAS-mutant CRC is generally resistant to cetuximab, although difference of the sensitivity among KRAS-mutants has not been studied in detail. We previously developed the cancer tissue-originated spheroid (CTOS) method, a primary culture method for cancer cells. We applied CTOS method to investigate whether ex vivo cetuximab sensitivity assays reflect the difference in sensitivity in the xenografts. Firstly, in vivo cetuximab treatment was performed with xenografts derived from 10 CTOS lines (3 KRAS-wildtype and 7 KRAS mutants). All two CTOS lines which exhibited tumor regression were KRAS-wildtype, meanwhile all KRAS-mutant CTOS lines grew more than the initial size: were resistant to cetuximab according to the clinical evaluation criteria, although the sensitivity was quite diverse. We divided KRAS-mutants into two groups; partially responsive group in which cetuximab had a substantial growth inhibitory effect, and resistant group which exhibited no effect. The ex vivo signaling assay with EGF stimulation revealed that the partially responsive group, but not the resistant group, exhibited suppressed ERK phosphorylation ex vivo. Furthermore, two lines from the partially responsive group, but none of the lines in the resistant group, exhibited a combinatory effect of cetuximab and trametinib, a MEK inhibitor, ex vivo and in vivo. Taken together, the results indicate that ex vivo signaling assay reflects the difference in sensitivity in vivo and stratifies KRAS mutant CTOS lines by sensitivity. Therefore, coupling the in vivo and ex vivo assays with CTOS can be a useful platform for understanding the mechanism of diversity in drug sensitivity.
Conflict of interest statement
Figures


Similar articles
-
4-Acetyl-Antroquinonol B Improves the Sensitization of Cetuximab on Both Kras Mutant and Wild Type Colorectal Cancer by Modulating the Expression of Ras/Raf/miR-193a-3p Signaling Axis.Int J Mol Sci. 2021 Jul 14;22(14):7508. doi: 10.3390/ijms22147508. Int J Mol Sci. 2021. PMID: 34299137 Free PMC article.
-
Combination therapy with zoledronic acid and cetuximab effectively suppresses growth of colorectal cancer cells regardless of KRAS status.Int J Cancer. 2016 Mar 15;138(6):1516-27. doi: 10.1002/ijc.29881. Epub 2015 Oct 23. Int J Cancer. 2016. PMID: 26437179 Free PMC article.
-
Effect of simvastatin on cetuximab resistance in human colorectal cancer with KRAS mutations.J Natl Cancer Inst. 2011 Apr 20;103(8):674-88. doi: 10.1093/jnci/djr070. Epub 2011 Mar 11. J Natl Cancer Inst. 2011. PMID: 21398618
-
KRAS status and resistance to epidermal growth factor receptor tyrosine-kinase inhibitor treatment in patients with metastatic colorectal cancer: a meta-analysis.Colorectal Dis. 2014 Nov;16(11):O370-8. doi: 10.1111/codi.12749. Colorectal Dis. 2014. PMID: 25155261 Review.
-
Cetuximab in the treatment of patients with colorectal cancer.Expert Opin Biol Ther. 2011 Jul;11(7):937-49. doi: 10.1517/14712598.2011.582464. Epub 2011 May 11. Expert Opin Biol Ther. 2011. PMID: 21557708 Review.
Cited by
-
Growth pattern of de novo small clusters of colorectal cancer is regulated by Notch signaling at detachment.Cancer Sci. 2024 Nov;115(11):3648-3659. doi: 10.1111/cas.16299. Epub 2024 Sep 19. Cancer Sci. 2024. PMID: 39300760 Free PMC article.
-
Human Blood Serum Can Diminish EGFR-_targeted Inhibition of Squamous Carcinoma Cell Growth through Reactivation of MAPK and EGFR Pathways.Cells. 2023 Aug 8;12(16):2022. doi: 10.3390/cells12162022. Cells. 2023. PMID: 37626832 Free PMC article.
-
Inhibition of the bone morphogenetic protein pathway suppresses tumor growth through downregulation of epidermal growth factor receptor in MEK/ERK-dependent colorectal cancer.Cancer Sci. 2023 Sep;114(9):3636-3648. doi: 10.1111/cas.15882. Epub 2023 Jun 25. Cancer Sci. 2023. PMID: 37357017 Free PMC article.
-
Anti-cancer effect of afatinib, dual inhibitor of HER2 and EGFR, on novel mutation HER2 E401G in models of patient-derived cancer.BMC Cancer. 2023 Jan 23;23(1):77. doi: 10.1186/s12885-022-10428-3. BMC Cancer. 2023. PMID: 36690964 Free PMC article.
-
Organoid: Next-Generation Modeling of Cancer Research and Drug Development.Front Oncol. 2022 Jan 28;11:826613. doi: 10.3389/fonc.2021.826613. eCollection 2021. Front Oncol. 2022. PMID: 35155215 Free PMC article. Review.
References
-
- Van Cutsem E, Cervantes A, Nordlinger B, Arnold D, Group EGW. Metastatic colorectal cancer: ESMO Clinical Practice Guidelines for diagnosis, treatment and follow-up. Ann Oncol. 2014;25 Suppl 3:iii1–9. - PubMed
-
- Tabernero J, Yoshino T, Cohn AL, Obermannova R, Bodoky G, Garcia-Carbonero R, et al. Ramucirumab versus placebo in combination with second-line FOLFIRI in patients with metastatic colorectal carcinoma that progressed during or after first-line therapy with bevacizumab, oxaliplatin, and a fluoropyrimidine (RAISE): a randomised, double-blind, multicentre, phase 3 study. Lancet Oncol. 2015;16(5):499–508. 10.1016/S1470-2045(15)70127-0 - DOI - PubMed
-
- Benvenuti S, Sartore-Bianchi A, Di Nicolantonio F, Zanon C, Moroni M, Veronese S, et al. Oncogenic activation of the RAS/RAF signaling pathway impairs the response of metastatic colorectal cancers to anti-epidermal growth factor receptor antibody therapies. Cancer Res. 2007;67(6):2643–8. 10.1158/0008-5472.CAN-06-4158 - DOI - PubMed
MeSH terms
Substances
Grants and funding
LinkOut - more resources
Full Text Sources
Other Literature Sources
Medical
Research Materials
Miscellaneous

