. 2017 Oct 24;9(10):142.
doi: 10.3390/cancers9100142.

The Role of Platelet-Derived ADP and ATP in Promoting Pancreatic Cancer Cell Survival and Gemcitabine Resistance

Affiliations

The Role of Platelet-Derived ADP and ATP in Promoting Pancreatic Cancer Cell Survival and Gemcitabine Resistance

Omar Elaskalani et al. Cancers (Basel). .

Abstract

Platelets have been demonstrated to be vital in cancer epithelial-mesenchymal transition (EMT), an important step in metastasis. Markers of EMT are associated with chemotherapy resistance. However, the association between the development of chemoresistance, EMT, and the contribution of platelets to the process, is still unclear. Here we report that platelets regulate the expression of (1) human equilibrative nucleoside transporter 1 (hENT1) and (2) cytidine deaminase (CDD), markers of gemcitabine resistance in pancreatic cancer. Human ENT1 (hENT1) is known to enable cellular uptake of gemcitabine while CDD deactivates gemcitabine. Knockdown experiments demonstrate that Slug, a mesenchymal transcriptional factor known to be upregulated during EMT, regulates the expression of hENT1 and CDD. Furthermore, we demonstrate that platelet-derived ADP and ATP regulate Slug and CDD expression in pancreatic cancer cells. Finally, we demonstrate that pancreatic cancer cells express the purinergic receptor P2Y12, an ADP receptor found mainly on platelets. Thus ticagrelor, a P2Y12 inhibitor, was used to examine the potential therapeutic effect of an ADP receptor antagonist on cancer cells. Our data indicate that ticagrelor negated the survival signals initiated in cancer cells by platelet-derived ADP and ATP. In conclusion, our results demonstrate a novel role of platelets in modulating chemoresistance in pancreatic cancer. Moreover, we propose ADP/ATP receptors as additional potential drug _targets for treatment of pancreatic cancer.

Keywords: ADP; ATP; gemcitabine; pancreatic cancer; platelets.


Conflict of interest statement

The authors report no conflict of interest.

Figures
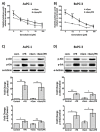
Figure 1
Figure 1
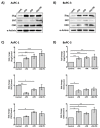
Platelet releasate (PR) promotes pancreatic ductal adenocarcinoma (PDAC) cell survival in the presence of gemcitabine. PDAC cell lines, AsPC-1 (A) or BxPC-3 (B), were seeded at 5000 cells/well, in a 96-well plate for 24 h, then treated with platelet releasate (PR) ± gemcitabine (0 to 100 µM) for 72 h. PR was prepared from xl-CRP (1 µg/mL)-aggregated platelets (5 × 10⁹ platelets/mL) and used in cell culture at 1:10 dilution, resulting in the final concentration equivalent to the amount of releasate from 5 × 10⁸ platelets/mL. Cell proliferation was quantified by Alamar blue reagent, a non-toxic cell health indicator dye that is converted to fluorescent red colour in living cells. The fluorescence intensity (ex/em 570 nm/610 nm) was quantified by a multi-mode plate reader (PerkinElmer). Statistics were calculated using two-way ANOVA, with n = 5 for (A) and n = 4 for (B), *** p < 0.0001, * p < 0.05. Changes in the phosphorylation status of Protein kinase B (Akt) and Extracellular signal-regulated kinase (Erk) in cancer cells at 2 h were determined following high-dose gemcitabine treatment (25 µM for AsPC-1 and 10 µM for BxPC-3). Briefly, cancer cells were seeded at 3 × 10⁵ cells/well in a 6-well plate for 24 h, serum starved for 6 h, then treated with PR ± gemcitabine for 2 h. Cell lysates were separated by SDS-PAGE and immunoblotted using phospho-specific antibodies for Akt (upper panel) and Erk1/2 (middle panel). Alpha (α)-actinin (lower panel) was used as loading controls for each protein. The expression level of the protein of interest was quantified and normalised to the loading control with automated software Image Lab (version 5.1, BioRad, CA, USA) and GraphPad Prism 5 (GraphPad Software, Inc, CA, USA). The columns represent fold changes in protein expression level compared to vehicle control-treated cells. Data are presented as mean ± SEM. One-way ANOVA with post-hoc Bonferroni’s Multiple Comparison Test was used to examine the significance of the mean, with n ≥ 4 for (C) and n ≥ 3 for (D), ** p < 0.001, * p < 0.05. Abbreviations: Gem—gemcitabine, xl-CRP—cross-linked Collagen-related peptide, PDAC—pancreatic ductal adenocarcinoma, PR—platelet releasate, Akt—Protein kinase B, Erk—Extracellular signal-regulated kinase, SDS-PAGE—sodium dodecyl sulfate polyacrylamide gel electrophoresis, ANOVA—Analysis of variance.
Figure 2
Figure 2
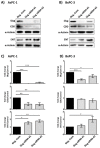
PR induces a rapid upregulation of Slug, an EMT and chemotherapy resistance marker, independent of the TGFβ1/Smad pathway. Representative immunoblots (A) and (B) show Slug expression in AsPC-1 and BxPC-3 cells after time course treatment with platelet releasate (PR). 2 × 10⁵ cancer cells per well were seeded in a 12-well plate for 24 h, serum starved for 6 h, then PR was added to the culture media (final concentration of PR was equivalent to releasate from 5 × 10⁸ platelets/mL) for 10 min, 30 min, 2 h, 6 h, 18 h and 24 h. Representative immune blots (C) and (D) show Slug and pSmad2/3 expression in AsPC-1 and BxPC-3 cells after treatment with PR ± 10 µM SB431542 (TGFβ1 receptor inhibitor) or 0.1%DMSO (vehicle control, Sigma-Aldrich, St. Louis, MO, USA) for 2 h. Cell lysates were separated by SDS-PAGE and immunoblotted using specific antibodies for Slug (upper panel), p-Smad2/3 (middle panel) and loading control protein α-actinin or β-tubulin (lower panel). Each of the immunoblots (A)–(D) is representative of two independent experiments with similar results. Representative immune blots (E) and (F) and the associated bar graphs show Slug expression in AsPC-1 and BxPC-3 cells after 2 h PR ± gemcitabine treatment. The expression level of the protein of interest was quantified relative to the loading control. The graph columns represent fold changes in protein expression level compared to vehicle-treated cells (n = 4 for (E) and n > 3 for (F)). One way ANOVA with post.-hoc Bonferroni’s Multiple Comparison Test was used to examine the significance of the mean (** p < 0.001, * p < 0.05).
Figure 3
Figure 3
Platelets modulate the expression of Slug, human equilibrative nucleoside transporter 1 (hENT1) and cytidine deaminase (CDD) in PDAC cells. Representative immunoblots (A) and (B) show the expression of Slug, hENT1 and CDD in AsPC-1 and BxPC-3 after treatment with platelets (Plt), platelet releasate (PR) or degranulated platelets (DG Plt) for 24 h. PR and degranulated platelets (DG Plt) were isolated from activated platelets. Briefly, platelets (1 × 10⁹/mL) were aggregated by incubating with 1 µg/mL CRP for 30 min then the supernatant (i.e., PR) and the pellet (i.e., DG Plt) were separated by centrifugation (5000 g for 10 min). The pellet was resuspended in Tyrode’s buffer, using the initial volume. The cancer cells were seeded in a 6-well plate at 3 × 10⁵ per well for 24 h, then incubated with Plt, PR or DG Plt to the final concentration equivalent to 1 × 10⁸ platelets/mL for 24 h in serum-free media. Cell lysates were separated by SDS-PAGE and immunoblotted using specific antibodies for Slug, hENT1, CDD and loading control protein α-actinin. Bar graphs (C) and (D) show the changes in the expression of Slug, hENT1 and CDD in AsPC-1 and BxPC-3 after different treatments. The expression level of the protein of interest was quantified relative to the loading control and normalised to the negative control group (n ≥ 3). Data are presented as mean ± SEM. One way ANOVA with post-hoc Bonferroni’s Multiple Comparison Test was used to examine the significance of the mean. *** p < 0.0001, ** p < 0.001, * p < 0.05.
Figure 4
Figure 4
Slug mediates the expression level of CDD and hENT1 in PDAC. Representative immunoblots (A) and (B) show the expression of Slug, hENT1 and CDD in AsPC-1 and BxPC-3 after Slug-specific siRNA treatment. 3 × 10⁵ cancer cells were seeded in 6-well plate for 24 h. Slug siRNAs (the number #1 and #2 designate two different Slug siRNA sequences) or a negative control siRNA (75 nM) in serum/antibiotic-free media were added to the adherent cells and incubated for 24 h. The media was then replaced with fresh media (+10% fetal bovine serum (FBS)) and cells incubated for a further 24 h before cells were lysed and examined for the expression of the proteins of interest. Bar graphs (C) and (D) show the expression of Slug, hENT1, CDD and loading control α-actinin in AsPC-1 and BxPC-3 post siRNA treatment. The expression levels were quantified relative to the loading control. The columns represent the fold change of protein levels relative to the negative control siRNA treated cells (n ≥ 3). Data are presented as mean ± SEM. One way ANOVA with post-hoc Bonferroni’s Multiple Comparison Test was used to examine the significance of the mean *** p < 0.0001, ** p < 0.001, * p < 0.05. Neg. Cont.: negative control.
Figure 5
Figure 5
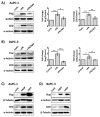
Platelet-derived ADP and ATP mediate Slug and CDD expression in PDAC cells. Representative immunoblots and bar graphs (A) and (B) show Slug and CDD expression in AsPC-1 and BxPC-3 cells after incubation with PR or PR pre-treated with apyrase (1 U/mL, for 30 min at 37 °C). 3 × 10⁵ cells were seeded in a 6-well plate for 24 h, then PR or apyrase pre-treated PR were added to the cancer cells for a further 24 h in serum-free media. The final concentration of PR used was equivalent to releasate from 5 × 10⁸ platelets/mL. Cell lysates were prepared and used in SDS-PAGE and immunoblotting as previously described. The expression levels of the proteins of interest were quantified relative to the loading control. The columns represent fold-change in protein expression level compared to control, vehicle-treated cells. Data are presented as mean ± SEM. One way ANOVA with post-hoc Bonferroni’s Multiple Comparison Test was used to examine the significance of the mean. n ≥ 4. *** P < 0.0001, ** P < 0.001, ** P < 0.05. Representative immunoblots (C) and (D), from two independent experiments, show Slug and CDD expression in AsPC-1 and BxPC-3 after exogenous ADP or ATP (100 µM) treatment for 24 h. cont.: control.
Figure 6
Figure 6
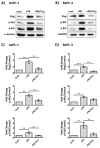
Anti-platelet drug ticagrelor, an antagonist of the purinergic receptor P2Y12 receptor, reduces the effects of PR on cancer cells. Representative immunoblots show Slug, p-Akt and p-Erk expression in AsPC-1 and BxPC-3 cells after incubation with PR ± ticagrelor (Tica, 10 µM) for 2 h. Sample preparations and immunoblotting were performed as previously described. The final concentration of PR used was equivalent to releasate from 5 × 10⁸ platelets/mL. Bar graphs (C) and (D) show the expression levels of the proteins of interest relative to the loading control. Columns represent fold change in protein expression level compared to control non-treated cells. n ≥ 5. *** p < 0.0001, ** p < 0.001, ** p < 0.05. Data are presented as mean ± SEM. One way ANOVA with post-hoc Bonferroni’s Multiple Comparison Test was used to examine the significance of the mean. cont.: control.

Similar articles

Cited by

References

    1. Falasca M., Kim M., Casari I. Pancreatic cancer: Current research and future directions. Biochim. Biophys. Acta. 2016;1865:123–132. doi: 10.1016/j.bbcan.2016.01.001. - DOI - PubMed
    1. Delluc A., Rousseau A., Delluc C., Le Moigne E., Le Gal G., Mottier D., van Dreden P., Lacut K. Venous thromboembolism in patients with pancreatic cancer: Implications of circulating tissue factor. Blood Coagul. Fibrinolysis. 2011;22:295–300. doi: 10.1097/MBC.0b013e32834512f4. - DOI - PubMed
    1. Weiler H. A platelet cloak for tumor cells. Blood. 2005;105:5–6. doi: 10.1182/blood-2004-10-3868. - DOI
    1. Palumbo J.S., Talmage K.E., Massari J.V., La Jeunesse C.M., Flick M.J., Kombrinck K.W., Jirouskova M., Degen J.L. Platelets and fibrin (ogen) increase metastatic potential by impeding natural killer cell-mediated elimination of tumor cells. Blood. 2005;105:178–185. doi: 10.1182/blood-2004-06-2272. - DOI - PubMed
    1. Kopp H.-G., Placke T., Salih H.R. Platelet-derived transforming growth factor-β down-regulates NKG2D thereby inhibiting natural killer cell antitumor reactivity. Cancer Res. 2009;69:7775–7783. doi: 10.1158/0008-5472.CAN-09-2123. - DOI - PubMed

LinkOut - more resources

  NODES
Association 1
innovation 6
twitter 2