. 2018 Jul 1:425:101-115.
doi: 10.1016/j.canlet.2018.03.037. Epub 2018 Mar 30.

Sorafenib improves alkylating therapy by blocking induced inflammation, invasion and angiogenesis in breast cancer cells

Affiliations

Sorafenib improves alkylating therapy by blocking induced inflammation, invasion and angiogenesis in breast cancer cells

Alfeu Zanotto-Filho et al. Cancer Lett. .

Abstract

Molecular _targeted compounds are emerging as a strategy to improve classical chemotherapy. Herein, we describe that using low dose of the multikinase inhibitor sorafenib improves cyclophosphamide antitumor activity by inhibiting angiogenesis, metastasis and promoting tumor healing in MDA-MB231 xenografts and the 4T1-12B syngeneic breast cancer metastasis model. Mechanistic studies in MDA-MB231 cells revealed that alkylation upregulates inflammatory genes/proteins such as COX-2, IL8, CXCL2 and MMP1 in a MEK1/2-ERK1/2-dependent manner. These proteins enrich the secretome of cancer cells, stimulating cell invasion and angiogenesis via autocrine and paracrine mechanisms. Sorafenib inhibits MEK1/2-ERK1/2 pathway thereby decreasing inflammatory genes and mitigating cell invasion and angiogenesis at basal and alkylation-induced conditions whereas NRF2 and ER stress pathways involved in alkylation survival are not affected. In non-invasive/non-angiogenic breast cancer cells (SKBR3 and MCF7), alkylation did not elicit inflammatory responses with the only sorafenib effect being ERK1/2-independent ROS-dependent cytotoxicity when using higher drug concentrations. In summary, our data show that alkylating agents may elicit inflammatory responses that seems to contribute to malignant progression in specific breast cancer cells. Identifying and _targeting drivers of this phenotype may offer opportunities to optimize combined drug regimens between classical chemotherapeutics and _targeted agents.

Keywords: Alkylation; Inflammation; MEK1/2-ERK1/2; Secretome; Sorafenib.


Conflict of interest statement

Conflict of Interest Statement: The authors declare that no conflict of interest exists

Figures

Figure 1
Figure 1. Tumor growth kinetics and histological characteristics of cyclophosphamide/sorafenib treated MDA-MB231 xenografts
(A) Sorafenib plasma concentration-time curves in nude mice after single intraperitoneal injection (0.02 mg/Kg; n=3/group). (B) Effect of sorafenib and cyclophosphamide on the growth kinetics of MDA-MB231 tumors in xenografts. Data are presented as mean±SD. *different from vehicle-treated; #different from sorafenib and from cyclophosphamide alone (Kruskal-Wallis/Dunns; p<0.05 as compared at the same time point). (C) Histopathological characteristics of MDA-MB231 tumors at the end of treatments as determined by H&E staining. (D) Representative microphotographs (10x magnification) showing the effect of cyclophosphamide/sorafenib on tumor vessels formation (CD31-IHC), proliferation (PCNA-IHC), and collagen and keratin deposition (Massom’s trichrome) in MDA-MB231 tumors. Blue and red areas represent collagen and keratin, respectively. The insert in the 4th panel of the Massom’s staining represents a collagen-rich area in cyclophosphamide/sorafenib treated tumors. (E) Quantification of relative microvessel, PCNA positivity, and collagen and keratin deposition in MDA-MB231 xenografts at the end of treatments. Asterisks denote differences from vehicle-treated controls (p<0.05; ***p<0.001); #different from sorafenib and from cyclophosphamide alone treatments at p<0.05 (Kruskal-Wallis/Dunns). Legends: Cyclo (Cyclophosphamide); Srfn (sorafenib).
Figure 2
Figure 2. Effects of sorafenib and cyclophosphamide in 4T1 model of breast cancer metastasis
(A) Schematic of experimental design used for treatments and assessment of tumor growth, metastasis and survival in the 4T1 model. (B) Representative animal images showing primary (mammary fat pad) and metastatic breast tumors at different time points (0, 10 and 32 days). The bottom table represent the proportion of animals displaying at least one metastatic site per group. *different from vehicle-treated at a p<0.05; **different from vehicle-treated at a p<0.005 (Z-test for proportions; One-tailed) (C) Quantification of tumor burden at different time points using luciferase-dependent bioluminescence. Total ROI luminescence (primary site+metastatic site) was measured. Asterisks denote differences at the indicated comparisons (2-way ANOVA, p<0.05). (D) Kaplan-Meier survival curves showing the impact of cyclophosphamide/sorafenib on overall survival. Log-rank test for curve comparisons and number of subjects at risk are also presented. Legends: Cyclo (Cyclophosphamide); Srfn (sorafenib).
Figure 3
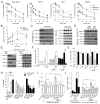
Figure 3. Effects of differing levels of sorafenib upon proliferation, invasion and angiogenesis of breast cancer cell lines
(A) Effect of differing concentrations of sorafenib alone or combined with IC50 levels of MMS (see Methods) and 4-HC (25 μM) in MDA-MB231, SKBR3, MCF7 and Hs578T after 48 h treatment as determined by Celltiter-Glo assay. (B) Effect of differing concentrations of sorafenib upon Caspase-3/7 activity in MDA-MB231 cells treated for 48 h. (C) Immunoblots showing the effect of sorafenib alone, (D) MMS and 4-HC alone and (E) sorafenib/MMS combination on the phosphorylation of MAPKs in breast cancer cells after 8 h treatment. (F) ROS production in MDA-MB231 cells as assessed by DCF assay after 24h treatment. Relative fluorescence values are expressed as fold-change compared to control. (G) Celltiter-Glo assays showing the effect of NAC upon sorafenib and MMS toxicity in MDA-MB231 cells after 48 h treatment. (H) Transwell assays showing the impact of sorafenib treatment upon cell invasion in MDA-MB231 and Hs578T cells. The left columns show comparative invasiveness of untreated/basal SKBR3, MCF7, MDA-MB231 and Hs578T cells. (I) CM prepared from sorafenib-treated cells attenuate basal and alkylation-induced cell invasion of MDA-MB231 cells (24 h invasion protocol). “fresh DMEM” column denotes cells incubated with non-conditioned DMEM. (J) Sorafenib inhibits recombinant VEGF-induced angiogenesis and decreases angiogenic effect of CM prepared from untreated (control) and MMS-treated cells. CM was prepared from MDA-MB231 treated with sorafenib +/− MMS. The “control” column denotes non-conditioned fresh DMEM incubated with endothelial cells. Data are presented as mean±SD. Unless otherwise specified, sorafenib was used at 1 μM; UO126 at 10 μM; and alkylating agent at IC50 concentration. Legends: Srfn (Sorafenib); VEGF (recombinant VEGFA); NAC (N-acetyl-cysteine, 7.5 mM) * different from untreated/control or at indicated comparisons. & different from MMS and sorafenib alone at same concentration (1-way-ANOVA-Tukey; p<0.05, n=3 in quadruplicate for “A”; n=3 in duplicate for “C” and “D”). See Figure S1 for supplementary data.
Figure 4
Figure 4. MMS and sorafenib-induced changes in gene expression of MDA-MB231 cells
(A) Heatmap and Venn diagram representation, (B) Pathway Enrichment Analysis and (C) Graphical representation of the most significant mRNA changes associated with MMS, Sorafenib (Srfn) and MMS+Srfn in 8 h treated MDA-MB231 cells as assessed by RNA sequencing. Heatmap and bar-charts represent the average mRNA log2 fold-change obtained from two independent experiments calculated as compared to control samples. Heatmap Region A: MMS-induced not altered by Srfn; Region B: MMS-induced Srfn-inhibited genes; Region C: Srfn-inhibited genes (alone); Region D: MMS-inhibited not altered by Srfn. See figure S3 for supplementary data.
Figure 5
Figure 5. Sorafenib inhibits expression of secretome genes involved in invasive and angiogenic activity
(A) ELISA assays showing sorafenib inhibition of basal and MMS-induced IL8, MMP1, MMP3, CXCL2 and PGE2 levels as determined in the culture medium of MDA-MB231 after 12 h treatment. Inflammatory protein levels in MCF-7 and SKBR3 cells are also shown. COX2 immunocontent was determined by western blot. (B) AP-1- and NFκB-luciferase reporter gene assays showing the effect of sorafenib and UO126 upon basal and MMS-induced NFkB and AP-1 transcription factor activity in MDA-MB231 cell line. Unless otherwise specified, sorafenib was used at 1 μM; UO126 at 10 μM; and alkylating agent at IC50 concentration. Legends: Srfn (sorafenib); ND (not detected); UO126 (10 μM). Data are presented as mean±SD. * different from untreated controls; &different from control and from MMS-treated cells (1-way-ANOVA-Tukey; p<0.05, n=3 in duplicate).
Figure 6
Figure 6. Sorafenib inhibits cyclophosphamide-induced inflammatory gene expression in vitro and MDA-MB231 xenografts
(A) 4-HC induces inflammatory proteins production in MDA-MB231 cells. The cells were treated for 12 h with 25 μM 4-HC for 12 h, and afterwards the culture medium was collected for ELISA analysis. (B) Representative IHC microphotographs showing protein content of MMP1, IL8, CXCL2, COX2 and IL6 in MDA-MB231 tumor xenografts treated with cyclophosphamide, sorafenib or combination of both. IHC score (0 to 3+) for each mice/tumor (n=8) is represented as a heatmap in the bottom of each microphotograph. IL8 IHC microphotographs also show peritumoral regions weakly stained.
Figure 7
Figure 7. Impact of alkylation-induced and sorafenib-inhibited genes on malignance parameters of breast cancer cells and correlation with patient survival
(A) Celltiter-Glo cell viability assays showing the impact of inflammatory genes knockdown and celecoxib treatment upon MMS cytotoxicity in MDA-MB231 cells after 72 h treatment. (B) Effect of inflammatory gene depletion on invasiveness of MDA-MB231 cells. siRNA transfections were performed directly in the cell seeding step on top-chambers of transwell plates and cell invasion was assessed after 48 h. Celecoxib and SB225002 were incubated directly in the top chamber of transwell plates. (C) The effect of inflammatory gene knockdown (by siRNA), COX-2 inhibition (celecoxib, 10 μM) and CXCR2 antagonist (SB225002, 15 μM) on the angiogenic potential of MDA-MB231 conditioned medium in vitro. (D) Log-rank test p-value (antilog) and Hazard ratio (HR) for the univariate analysis of correlation between sorafenib-inhibited inflammation-related genes expression and breast cancer patient overall survival (OS) as assessed by BreastMark tool. The most significant HR are annotated with the graph. (E) Kaplan-Meier plots of the top-3 survival related genes (IL8, MMP1 and VEGFA; obtained from “D”) as a single or combined predictor signatures of breast cancer patients survival. Legends: si (siRNA); rec (recombinant). Data are presented as mean±SD. * different from untreated/scrambled siRNA controls or at indicated comparisons. &different from control and from alkylation/MMS-treated cells (1way-ANOVA-Tukey; p<0.05, n=3 in duplicate). See S3 for supplementary data.
Figure 8
Figure 8
Schematic representation of the different alkyation responses identified in MDA-MB231 cells. MMS induces NRF2 and ER stress pathways involved in cell survival control whereas the BRAF-MEK1/2-ERK1/2 branch promotes inflammatory gene expression, angiogenesis and invasion in a sorafenib-inhibited manner.

Similar articles

Cited by

References

    1. Fu D, Calvo JA, Samson LD. Balancing repair and tolerance of DNA damage caused by alkylating agents. Nat Rev Cancer. 2012;12:104–20. - PMC - PubMed
    1. Klapacz J, Pottenger LH, Engelward BP, Heinen CD, Johnson GE, Clewell RA, et al. Contributions of DNA repair and damage response pathways to the non-linear genotoxic responses of alkylating agents. Mutat Res Rev Mutat Res Netherlands. 2016;767:77–91. - PMC - PubMed
    1. Zanotto-Filho A, Dashnamoorthy R, Loranc E, de Souza LHT, Moreira JCF, Suresh U, et al. Combined Gene Expression and RNAi Screening to Identify Alkylation Damage Survival Pathways from Fly to Human. PLoS One United States. 2016;11:e0153970. - PMC - PubMed
    1. Zanotto-Filho A, Masamsetti VP, Loranc E, Tonapi SS, Gorthi A, Bernard X, et al. Alkylating Agent-Induced NRF2 Blocks Endoplasmic Reticulum Stress-Mediated Apoptosis via Control of Glutathione Pools and Protein Thiol Homeostasis. Mol Cancer Ther United States. 2016;15:3000–14. - PMC - PubMed
    1. Hanahan D, Weinberg RA. Hallmarks of cancer: the next generation. Cell United States. 2011;144:646–74. - PubMed

Publication types

MeSH terms

  NODES
admin 4
Note 3
Project 1
twitter 2