Nitrogen-Doped Graphene Oxide Dots-Based "Turn-OFF" H2O2, Au(III), and "Turn-OFF-ON" Hg(II) Sensors as Logic Gates and Molecular Keypad Locks
- PMID: 31460168
- PMCID: PMC6648105
- DOI: 10.1021/acsomega.9b00858
Nitrogen-Doped Graphene Oxide Dots-Based "Turn-OFF" H2O2, Au(III), and "Turn-OFF-ON" Hg(II) Sensors as Logic Gates and Molecular Keypad Locks
Abstract
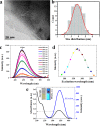
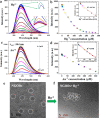
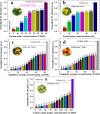
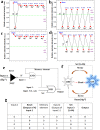
Fluorescent nitrogen-doped graphene oxide dots (NGODs) have been demonstrated as an on-off nanosensor for the detection of Hg2+, Au3+, and H2O2. As compared to l-cystine, where the luminescence signal recovery results from the detachment of Hg2+ from the NGODs, signal recovery through l-ascorbic acid (turn-off-on model) has been attributed to the reduction of Hg2+ to Hg0. The sustainable recovery of the photoluminescence signal is demonstrated using common citrus fruits containing vitamin C (l-AA), suggesting a promising practical usage of this sensing system. Additionally, the sensitivity of NGOD- and AA-originated signal recovery from the Hg(II)-NGODs mixture has been successfully tested in Hg2+ ion-spiked tap water from three different places. Mimic devices were executed and verified on the basis of characteristic spectral changes, and the possible utility of this system in electronic security and memory element devices has also been demonstrated. Considering an easy synthesis process and excellent performance of NGODs, this investigation opens up new opportunities for preparing high-quality fluorescent NGODs to meet the requirements of many applications.
Conflict of interest statement
The authors declare no competing financial interest.
Figures


Similar articles
-
Biocompatible hole scavenger-assisted graphene oxide dots for photodynamic cancer therapy.Nanoscale. 2021 May 13;13(18):8431-8441. doi: 10.1039/d1nr01476e. Nanoscale. 2021. PMID: 33912878
-
Pineapple Peel-Derived Carbon Dots: Applications as Sensor, Molecular Keypad Lock, and Memory Device.ACS Omega. 2018 Oct 31;3(10):12584-12592. doi: 10.1021/acsomega.8b01146. Epub 2018 Oct 4. ACS Omega. 2018. PMID: 30411011 Free PMC article.
-
Concise nanotherapeutic modality for cancer involving graphene oxide dots in conjunction with ascorbic acid.Nanoscale. 2023 Jun 23;15(24):10232-10243. doi: 10.1039/d3nr00431g. Nanoscale. 2023. PMID: 37183719
-
One-pot green synthesis of oxygen-rich nitrogen-doped graphene quantum dots and their potential application in pH-sensitive photoluminescence and detection of mercury(II) ions.Talanta. 2015 Sep 1;142:131-9. doi: 10.1016/j.talanta.2015.04.059. Epub 2015 Apr 28. Talanta. 2015. PMID: 26003702
-
Nitrogen-doped graphene and graphene quantum dots: A review onsynthesis and applications in energy, sensors and environment.Adv Colloid Interface Sci. 2018 Sep;259:44-64. doi: 10.1016/j.cis.2018.07.001. Epub 2018 Jul 19. Adv Colloid Interface Sci. 2018. PMID: 30032930 Review.
Cited by
-
Heavy metal ion detection using green precursor derived carbon dots.iScience. 2022 Jan 25;25(2):103816. doi: 10.1016/j.isci.2022.103816. eCollection 2022 Feb 18. iScience. 2022. PMID: 35198881 Free PMC article. Review.
-
Carbon Dots-Based Logic Gates.Nanomaterials (Basel). 2021 Jan 17;11(1):232. doi: 10.3390/nano11010232. Nanomaterials (Basel). 2021. PMID: 33477327 Free PMC article. Review.
-
Long-Wavelength Fluorescent Chemosensors for Hg2+ based on Pyrene.ACS Omega. 2019 Aug 29;4(11):14621-14625. doi: 10.1021/acsomega.9b02078. eCollection 2019 Sep 10. ACS Omega. 2019. PMID: 31528817 Free PMC article.
-
Persea americana seed extract mediated gold nanoparticles for mercury(ii)/iron(iii) sensing, 4-nitrophenol reduction, and organic dye degradation.RSC Adv. 2019 Dec 2;9(68):39834-39842. doi: 10.1039/c9ra08233f. eCollection 2019 Dec 2. RSC Adv. 2019. PMID: 35541370 Free PMC article.
-
Nitrogen-Doped Carbon Dots Induced Enhancement in CO2 Sensing Response From ZnO-Porous Silicon Hybrid Structure.Front Chem. 2020 May 5;8:291. doi: 10.3389/fchem.2020.00291. eCollection 2020. Front Chem. 2020. PMID: 32432075 Free PMC article.
References
-
- Li L.-L.; Ji J.; Fei R.; Wang C.-Z.; Lu Q.; Zhang J.-R.; Jiang L.-P.; Zhu J.-J. A Facile Microwave Avenue to Electro-chemiluminescent Two-Color Graphene Quantum Dots. Adv. Funct. Mater. 2012, 22, 2971–2979. 10.1002/adfm.201200166. - DOI
LinkOut - more resources
Full Text Sources
Research Materials
Miscellaneous

