Mapping the increased minimum mortality temperatures in the context of global climate change
- PMID: 31604931
- PMCID: PMC6789034
- DOI: 10.1038/s41467-019-12663-y
Mapping the increased minimum mortality temperatures in the context of global climate change
Abstract
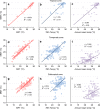
Minimum mortality temperature (MMT) is an important indicator to assess the temperature-mortality relationship. It reflects human adaptability to local climate. The existing MMT estimates were usually based on case studies in data rich regions, and limited evidence about MMT was available at a global scale. It is still unclear what the most significant driver of MMT is and how MMT will change under global climate change. Here, by analysing MMTs in 420 locations covering six continents (Antarctica was excluded) in the world, we found that although the MMT changes geographically, it is very close to the local most frequent temperature (MFT) in the same period. The association between MFT and MMT is not changed when we adjust for latitude and study year. Based on the MFT~MMT association, we estimate and map the global distribution of MMTs in the present (2010s) and the future (2050s) for the first time.
Conflict of interest statement
The authors declare no competing interests.
Figures


Similar articles
-
Projecting future minimum mortality temperature in China.Ecotoxicol Environ Saf. 2024 Nov 1;286:117192. doi: 10.1016/j.ecoenv.2024.117192. Epub 2024 Oct 19. Ecotoxicol Environ Saf. 2024. PMID: 39427536
-
Global drivers of minimum mortality temperatures in cities.Sci Total Environ. 2019 Dec 10;695:133560. doi: 10.1016/j.scitotenv.2019.07.366. Epub 2019 Aug 9. Sci Total Environ. 2019. PMID: 31422334
-
Geographical Variations of the Minimum Mortality Temperature at a Global Scale: A Multicountry Study.Environ Epidemiol. 2021 Sep 24;5(5):e169. doi: 10.1097/EE9.0000000000000169. eCollection 2021 Oct. Environ Epidemiol. 2021. PMID: 34934890 Free PMC article.
-
Population adaptation to heat as seen through the temperature-mortality relationship, in the context of the impact of global warming on health: A scoping review.Sci Total Environ. 2024 Jan 15;908:168441. doi: 10.1016/j.scitotenv.2023.168441. Epub 2023 Nov 8. Sci Total Environ. 2024. PMID: 37949135 Review.
-
Plants and global warming: challenges and strategies for a warming world.Plant Cell Rep. 2024 Jan 2;43(1):27. doi: 10.1007/s00299-023-03083-w. Plant Cell Rep. 2024. PMID: 38163826 Review.
Cited by
-
Drivers of associations between daytime-nighttime compound temperature extremes and mortality in China.Commun Med (Lond). 2024 Jun 27;4(1):125. doi: 10.1038/s43856-024-00557-0. Commun Med (Lond). 2024. PMID: 38937621 Free PMC article.
-
Evaluation Methods for Water Resource Suitability in Territorial Spatial Planning: A Case Study of Baiyin City in a Semi-Arid Region.Int J Environ Res Public Health. 2022 Oct 10;19(19):12973. doi: 10.3390/ijerph191912973. Int J Environ Res Public Health. 2022. PMID: 36232270 Free PMC article.
-
Associations Between Extreme Temperatures and Cardiovascular Cause-Specific Mortality: Results From 27 Countries.Circulation. 2023 Jan 3;147(1):35-46. doi: 10.1161/CIRCULATIONAHA.122.061832. Epub 2022 Dec 12. Circulation. 2023. PMID: 36503273 Free PMC article.
-
From single to multivariable exposure models to translate climatic and air pollution effects into mortality risk. A customized application to the city of Rome, Italy.MethodsX. 2022 May 5;9:101717. doi: 10.1016/j.mex.2022.101717. eCollection 2022. MethodsX. 2022. PMID: 35620759 Free PMC article.
-
Human tolerance to extreme heat: evidence from a desert climate population.J Expo Sci Environ Epidemiol. 2023 Jul;33(4):631-636. doi: 10.1038/s41370-023-00549-7. Epub 2023 May 3. J Expo Sci Environ Epidemiol. 2023. PMID: 37138035
References
-
- Yang J, et al. Cardiovascular mortality risk attributable to ambient temperature in China. Heart. 2015;101:1966–1972. - PubMed
-
- Watts N, et al. Health and climate change: policy responses to protect public health. Lancet. 2015;386:1861–1914. - PubMed
-
- Kinney PL. Heath: A new measure of health effects. Nat. Clim. Change. 2012;2:233–234.
Publication types
MeSH terms
LinkOut - more resources
Full Text Sources

