Elevated plasma levels of exosomal BACE1‑AS combined with the volume and thickness of the right entorhinal cortex may serve as a biomarker for the detection of Alzheimer's disease
- PMID: 32377715
- PMCID: PMC7248487
- DOI: 10.3892/mmr.2020.11118
Elevated plasma levels of exosomal BACE1‑AS combined with the volume and thickness of the right entorhinal cortex may serve as a biomarker for the detection of Alzheimer's disease
Abstract
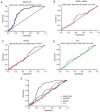
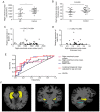
Long non-coding RNA (lncRNA) and exosomes are involved in the pathological process of Alzheimer's disease (AD), the pathological changes of which are usually first observed in the entorhinal cortex and hippocampus. The aim of the present study was to determine whether the measurement of plasma exosomal lncRNA combined with image data of the entorhinal cortex and hippocampus could be used as a biomarker of AD. A total of 72 patients with AD and 62 controls were recruited, and the expression levels of several lncRNAs were assessed. Of the recruited participants, 22 patients and 26 controls received brain 3D‑BRAVO sequence magnetic resonance imaging (MRI) scans, which were analyzed using an automated analysis tool. The plasma exosomal β‑site amyloid precursor protein cleaving enzyme‑1‑antisense transcript (BACE1‑AS) levels in patients with AD were significantly higher compared with the controls (P<0.005). Receiver operating characteristic curve analysis revealed that the area under the curve (AUC) was 0.761 for BACE1‑AS, the sensitivity was 87.5%, and the specificity was 61.3%. Analysis of MRI images indicated that the right entorhinal cortex volume (P=0.015) and thickness (P=0.022) in patients with AD were significantly smaller. The AUC was 0.688 for the right entorhinal cortex volume, with a sensitivity of 59.1%, and the specificity was 84.6%. The AUC was 0.689 for right entorhinal cortex thickness, with a sensitivity of 80.8%, and the specificity was 59.1%. A series‑parallel test which integrated the BACE1‑AS with the right entorhinal cortex volume and thickness, raised the specificity and sensitivity to 96.15 and 90.91%, respectively. A logistic regression model demonstrated that combination of the 3 indices provided improved sensitivity and specificity simultaneously, particularly when adjusting for age and sex (AUC, 0.819; sensitivity, 81%; specificity, 73.1%). The results of the present study demonstrated that detection of plasma exosomal BACE1‑AS levels combined with the volume and thickness of the right entorhinal cortex may be used as a novel biomarker of AD.
Keywords: alzheimer's disease; exosome; β-site amyloid precursor protein cleaving enzyme-1-antisense transcript; biomarker; entorhinal cortex.
Figures


Similar articles
-
Long Non-coding RNA BACE1-AS May Serve as an Alzheimer's Disease Blood-Based Biomarker.J Mol Neurosci. 2019 Nov;69(3):351-359. doi: 10.1007/s12031-019-01364-2. Epub 2019 Jul 1. J Mol Neurosci. 2019. PMID: 31264051 Clinical Trial.
-
Comparison of imaging biomarkers for Alzheimer's disease: amyloid imaging with [18F]florbetapir positron emission tomography and magnetic resonance imaging voxel-based analysis for entorhinal cortex atrophy.Int J Geriatr Psychiatry. 2015 May;30(5):505-13. doi: 10.1002/gps.4173. Epub 2014 Jul 7. Int J Geriatr Psychiatry. 2015. PMID: 25043833
-
Differentiation of mild cognitive impairment using an entorhinal cortex-based test of virtual reality navigation.Brain. 2019 Jun 1;142(6):1751-1766. doi: 10.1093/brain/awz116. Brain. 2019. PMID: 31121601 Free PMC article.
-
Plasma neuronal exosomes serve as biomarkers of cognitive impairment in HIV infection and Alzheimer's disease.J Neurovirol. 2019 Oct;25(5):702-709. doi: 10.1007/s13365-018-0695-4. Epub 2019 Jan 4. J Neurovirol. 2019. PMID: 30610738 Free PMC article. Review.
-
From healthy aging to early Alzheimer's disease: in vivo detection of entorhinal cortex atrophy.Ann N Y Acad Sci. 2000 Jun;911:240-53. doi: 10.1111/j.1749-6632.2000.tb06730.x. Ann N Y Acad Sci. 2000. PMID: 10911878 Review.
Cited by
-
Locus specific endogenous retroviral expression associated with Alzheimer's disease.Front Aging Neurosci. 2023 Jul 6;15:1186470. doi: 10.3389/fnagi.2023.1186470. eCollection 2023. Front Aging Neurosci. 2023. PMID: 37484691 Free PMC article.
-
Identification of key regulatory molecules in the early development stage of Alzheimer's disease.J Cell Mol Med. 2024 Mar;28(6):e18151. doi: 10.1111/jcmm.18151. J Cell Mol Med. 2024. PMID: 38429903 Free PMC article.
-
Dual role of brain-derived extracellular vesicles in dementia-related neurodegenerative disorders: cargo of disease spreading signals and diagnostic-therapeutic molecules.Transl Neurodegener. 2022 Nov 27;11(1):50. doi: 10.1186/s40035-022-00326-w. Transl Neurodegener. 2022. PMID: 36437458 Free PMC article. Review.
-
Screening of plasma exosomal lncRNAs to identify potential biomarkers for obstructive sleep apnea.Ann Transl Med. 2022 Sep;10(17):936. doi: 10.21037/atm-22-3818. Ann Transl Med. 2022. PMID: 36172105 Free PMC article.
-
Explainable Machine Learning with Pairwise Interactions for Predicting Conversion from Mild Cognitive Impairment to Alzheimer's Disease Utilizing Multi-Modalities Data.Brain Sci. 2023 Oct 31;13(11):1535. doi: 10.3390/brainsci13111535. Brain Sci. 2023. PMID: 38002495 Free PMC article.
References
MeSH terms
Substances
LinkOut - more resources
Full Text Sources
Medical
Research Materials

