. 2021 Nov 16;37(7):110013.
doi: 10.1016/j.celrep.2021.110013.

Autotaxin impedes anti-tumor immunity by suppressing chemotaxis and tumor infiltration of CD8+ T cells

Affiliations

Autotaxin impedes anti-tumor immunity by suppressing chemotaxis and tumor infiltration of CD8+ T cells

Elisa Matas-Rico et al. Cell Rep. .

Abstract

Autotaxin (ATX; ENPP2) produces lysophosphatidic acid (LPA) that regulates multiple biological functions via cognate G protein-coupled receptors LPAR1-6. ATX/LPA promotes tumor cell migration and metastasis via LPAR1 and T cell motility via LPAR2, yet its actions in the tumor immune microenvironment remain unclear. Here, we show that ATX secreted by melanoma cells is chemorepulsive for tumor-infiltrating lymphocytes (TILs) and circulating CD8+ T cells ex vivo, with ATX functioning as an LPA-producing chaperone. Mechanistically, T cell repulsion predominantly involves Gα12/13-coupled LPAR6. Upon anti-cancer vaccination of tumor-bearing mice, ATX does not affect the induction of systemic T cell responses but, importantly, suppresses tumor infiltration of cytotoxic CD8+ T cells and thereby impairs tumor regression. Moreover, single-cell data from melanoma tumors are consistent with intratumoral ATX acting as a T cell repellent. These findings highlight an unexpected role for the pro-metastatic ATX-LPAR axis in suppressing CD8+ T cell infiltration to impede anti-tumor immunity, suggesting new therapeutic opportunities.

Keywords: G protein-coupled receptors; T cells; anti-cancer vaccination; autotaxin; chemorepulsion; immunotherapy; lysophosphatidic acid; melanoma; single-cell RNAseq; tumor microenvironment.


Conflict of interest statement

Declaration of interests Z.J. is an employee and shareholder of iOnctura SA, a company developing an ATX inhibitor for use in cancer.

Figures

Figure 1.
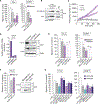
Figure 1.. LPA and ATX/LPC are chemorepulsive for TILs and peripheral CD8+ T cells
(A) Transwell migration of ex vivo expanded TILs from two melanoma patients stimulated with LPA(18:1) at the indicated concentrations. Chemokine CXCL10 (1 μM) was used as positive control; “control” refers to serum-free medium. Agonists were added to the bottom wells and incubation was carried out for 2 h at 37°C. (B) LPA dose-dependency of migration. The inset shows a representative transwell filter after staining. Migration was quantified by color intensity using ImageJ. (C) LPA overrules CXCL10-induced TIL chemotaxis. LPA(18:1) was added together with CXCL10 at the indicated concentrations. (D) Migration of CD8+ T cells isolated from peripheral blood, measured in the absence (control) and presence of the indicated concentrations of LPA(18:1). Note that the presence of 0.5% serum has no effect. (E) Recombinant ATX (20 nM) added together with the indicated concentrations of LPC(18:1) recapitulates the inhibitory effects of LPA(18:1) on TILs and CD8+ T cells. (A and C–E) Results are representative of three independent experiments each performed in technical triplicates and expressed as means ± SEM; bars annotated with different letters were significantly different according to Fisher’s least significant difference (LSD) test (p ≤ 0.05) after ANOVA.
Figure 2.
Figure 2.. ATX secreted by melanoma cells repels TILs and peripheral CD8+ T cells
(A) Melanoma-conditioned medium from MDA-MB-435 and A375 cells (collected after 24 h) is chemorepulsive for TILs and blood-derived CD8+ T cells. Experimental conditions as in Figure 1. (B) Immunoblot showing ATX expression in medium and cell lysates of MDA-MB-435 and A375 melanoma cells. Cells were incubated in DMEM with 0.5% FCS for 24 or 48 h. Recombinant ATX (20 nM) was used as positive control (right lane). (C) LysoPLD activity accumulating in melanoma-conditioned media over time. Medium from MDA-MB-435 cells was collected after 2 and 24 h, and lysoPLD activity was measured as choline release from added LPC(18:1). (D) ATX (ENPP2) mRNA expression (relative to cyclophilin) in control and ENPP2-depleted MDA-MB-435 cells stably expressing short hairpin RNAs (shRNAs) against ATX. Maximal ENPP2 knockdown was obtained with shRNA 1 and 4 (of 5 different hairpins). Data represent the mean ± SEM of three independent experiments using triplicate samples; ****p < 0.0001 (unpaired Student’s t test). Right: immunoblot analysis of ATX expression using shRNA 1 and 4. Actin was used as loading control. (E) Melanoma-conditioned medium from ATX knockdown MDA-MD-435 cells (collected after 24 h) lacks chemorepulsive activity for CD8+ T cells and TILs. (F) Conditioned media from ATX-deficient MDA-MB-231 breast carcinoma cells lack chemo-repulsive activity for TILs compared to media from ATX-expressing melanoma cells (MDA-MB-435 and A375; cf. A). Right panel: ATX immunoblots from the indicated media and cell lysates. (G) ATX inhibition restores the migration TILs and CD8+ T cells exposed to melanoma cell-conditioned media. Cells were plated at day 0 in medium containing 10% FCS. After 16 h, cells were exposed to medium containing 0.5% FCS and ATX inhibitors (PF-8380 or IOA-289). Conditioned media were collected after 24 h. (A and D–G) Representative data of three independent experiments each performed in triplicate. Values are expressed as mean ± SEM; bars annotated with different letters were significantly different according to Fisher’s least significant difference (LSD) test (p ≤ 0.05) after ANOVA.
Figure 3.
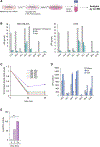
Figure 3.. Lysolipid species and secreted lysoPLD activity in conditioned media from melanoma cells
(A) Preparation of cell-conditioned media. Melanoma cells in 10-cm dishes were cultured for 24 h, washed, and then incubated in DMEM containing 0.5% FCS. Media were harvested after 24 and 48 h, and centrifuged to remove cell debris. LPA species were measured using LC/MS/MS. (B) Determination of LPA species in conditioned medium from MDA-MB-435 and A375 melanoma cells, measured at t = 0, 24, and 48 h, using LC/MS/MS. Predominant serum-borne LPA species are (12:0), (16:0), (18:0), (18:1) and (20:4). Note LPA depletion from the medium (within 24 h) upon incubation with ATX-secreting melanoma cells. (C) Time-dependent decline of the indicated serum-borne LPA species by melanoma cells. Graph shows normalized steady-state LPA levels in conditioned media from MDA-MB-435 cells. (D) LPC species in conditioned medium from MDA-MB-435 cells, measured at t = 10 min, 2 h and 24 h, using LC/MS/MS. Note that LPC levels tend to increase over time. Values from one experiment performed in triplicate and expressed as mean ± SEM. (E) Secreted lysoPLD activity increases over time. Medium from MDA-MB-435 cells was collected after 2 and 24 h, and lysoPLD activity was measured as choline release from added LPC(18:1). Values from three independent experiments each performed in triplicate and expressed as mean ± SEM; **p < 0.01 (unpaired Student’s t test).
Figure 4.
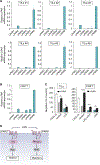
Figure 4.. LPAR expression in TILs and peripheral CD8+ T cells
(A) LPAR expression repertoire in ex vivo expanded TILs from six patients (qPCR analysis relative to cyclophilin). TIL values are expressed as mean ± SD. (B) LPAR expression in peripheral CD8+ T cells from two healthy donors. Values are expressed as mean ± SD. (C) LPAR6 antagonist XAA restores transwell migration of TILs (left panel) and CD8+ T cells (right panel) in response to LPA or ATX plus LPC. Conditions as in Figure 1. Cells were treated with XAA (10 μM) or vehicle control (0.5% DMSO) for 24 h. Data represent the mean ± SEM of three independent experiments using triplicate samples. Data represent the mean ± SEM of three independent experiments using duplicate samples. *p < 0.05, ****p < 0.0001 (unpaired Student’s t test). (D) Schematic illustration of dominant G-protein coupling and signaling outcomes of LPAR2 versus LPAR6.
Figure 5.
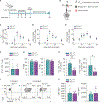
Figure 5.. Enforced ATX expression in tumor cells does not affect induction of T cell responses by vaccination
(A) Experimental set-up in the anti-cancer vaccination model. Mice were injected s.c. with wild-type (TC-1WT) or ATX-expressing (TC-1ATX) tumor cells on day 0, vaccinated on days 8, 11, and 14 and were either sacrificed on day 18, or monitored until day 70. Tumor cells were injected into one flank and the vaccine DNA was “tattooed” into the depilated skin of the opposing flank. Data are from one experiment representative of two experiments. (B) The DNA vaccine encodes HPV-E7 protein together with tumor-unrelated helper epitopes. The CD8+ T cells that have a TCR specific for the immunodominant E749–57 peptide presented in H-2Db can be detected with MHC class I (MHC-I) tetramers. A tetramer is made by folding E749–57 peptide with MHC-I monomer, conjugating this to biotin and multimerizing it with fluorochrome-conjugated streptavidin. (C–E) Monitoring of the T cell response to vaccination in peripheral blood by flow cytometry in TC-1WT (n = 6) and TC-1ATX (n = 5) tumor-bearing mice. (C) Frequency of H-2Db/E749–57 tetramer positive (Tet+) cells among total CD8+ T cells. (D and E) Frequency of cells with a CD44+CD62L effector phenotype among total CD8+ T cells (D) or total CD4+ T cells (E). (F–J) Analysis of the CD8+ T cell response in spleen (F–J) and tumor (H and J) on day 18 in TC-1WT (n = 5) and TC-1ATX (n = 6) tumor-bearing mice. (F) Absolute number of tetramer positive (Tet+) CD8+ T cells in spleen. (G) Frequency of granzyme B (GZB)+ and IFNγ+ cells among Tet+ CD8+ T cells in spleen. IFNγ was measured after ex vivo PMA/ionomycin stimulation. The dotted line indicates IFNγ signal in unstimulated cells. (H) Frequency among CD45+ hematopoietic cells (left) and absolute number (#, right) of Tet+ CD8+ T cells in TC-1WT and TC-1ATX tumors. (I) Representative flow cytometry plots indicating the percentage of Tet+ cells among total CD8+ T cells in TC-1WT and TC-1ATX tumors after vaccination and in TC-1WT tumors of non-vaccinated (untreated) mice. (J) Mean fluorescence intensity (MFI) of GZB+ and IFNγ+ cells within Tet+ CD8+ T cells in TC-1WT and TC-1ATX tumors. IFNγ was measured as in (G). (C–H and J) Data are expressed as mean ± SD; *p < 0.05, **p < 0.01 (Mann-Whitney U test).
Figure 6.
Figure 6.. Enforced ATX expression in tumor cells inhibits infiltration of effector CD8+ T cells and impedes vaccine-induced tumor control
(A–F) Tumor analysis by immunohistochemistry on day 18 in the same mice as analyzed in Figure 5. (A) Representative heatmaps of CD8+ immunostainings of tumor sections from vaccinated mice bearing TC-1WT or TC-1ATX tumors. (B–D) Quantification in percentages of CD8+ (B, representative for the data shown in A), CD4+ (C), and FOXP3+ (D) cells out of all nucleated cells as assessed by immunostaining of tumor sections from vaccinated mice bearing TC-1WT or TC-1ATX tumors. Data are depicted as mean + SD, *p < 0.05 (Mann-Whitney U test). (E–G) TC-1WT (n = 6) and TC-1ATX (n = 5) tumor-bearing mice received vaccination as outlined in Figure 5 and tumor growth was monitored over time up to day 70. (E) Individual growth curves of TC-1WT and TC-1ATX tumors in vaccinated mice. Black lines represent group average. (F) Tumor growth delay following vaccination, expressed as number of days required to reach a tumor size corresponding to that at day 7 (see E). Data are depicted as mean + SD, *p < 0.05 (Mann-Whitney U test). (G) Overall survival curves of tumor-bearing mice. **p < 0.01 (Mantel-Cox analysis). Data in this figure are from one experiment representative of two independent experiments.
Figure 7.
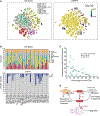
Figure 7.. Single-cell analysis of ENNP2 expression in melanoma tumors and its inverse correlation with CD8+ T cell accumulation
(A) t-distributed stochastic neighbor embedding (tSNE) embedding of 7,186 single cells (complexity = 5) from 32 melanoma patients as described (Jerby-Arnon et al., 2018). Data were used to project patients, inferred cell types, and log2 ENPP2 expression values, respectively, as described in STAR Methods. Right panel shows ENPP2 expression (blue/purple dots high expression) as overlay on single cells presented in the left panel. Intratumoral ENPP2 expression is detected in malignant cells (mal), cancer-associated fibroblasts (caf), macrophages, and endothelial cells (endo), but not in lymphocytes (T, B, and NK cells). (B) Stacked bar graph showing the percentages of inferred cell type per individual patient sample (top), and the percentage of ENPP2-expressing cell types (bottom). (C) Inverse correlation between intratumoral ENPP2 expression and CD8+ T cell accumulation. Pearson correlation between the percentage of inferred ENPP2-expressing cells and CD8+-positive cells (R = 0.4; p = 0.01). (D) Model of the melanoma immune microenvironment. In this model, ATX is secreted by melanoma cells and diverse stromal cells, particularly fibroblasts (CAFs), to convert extracellular LPC into LPA. ATX functions as an LPA-producing chaperone (ATX:LPA) that carries LPA to its GPCRs and exerts dual actions: it suppresses T cell infiltration through G12/13-coupled LPAR6, while it promotes melanoma cell dispersal and activates CAFs via LPAR1 (mainly via GI). Activated CAFs release growth factors and produce extracellular matrix. Random T cell motility mediated by LPAR2 is not illustrated (see Figure 4D). See text for further details.

Similar articles

Cited by

References

    1. Ahrends T, Bąba1a N, Xiao Y, Yagita H, van Eenennaam H, and Borst J (2016). CD27 Agonism Plus PD-1 Blockade Recapitulates CD4+ T-cell Help in Therapeutic Anticancer Vaccination. Cancer Res. 76, 2921–2931. - PubMed
    1. Ahrends T, Spanjaard A, Pilzecker B, Bąba1a N, Bovens A, Xiao Y, Jacobs H, and Borst J<.au> (2017). CD4+ T Cell Help Confers a Cytotoxic T Cell Effector Program Including Coinhibitory Receptor Downregulation and Increased Tissue Invasiveness. Immunity 47, 848–861.e5. - PubMed
    1. Anandappa AJ, Wu CJ, and Ott PA (2020). Directing Traffic: How to Effectively Drive T Cells into Tumors. Cancer Discov. 10, 185–197. - PMC - PubMed
    1. Aoki J, Inoue A, and Okudaira S (2008). Two pathways for lysophosphatidic acid production. Biochim. Biophys. Acta 1781, 513–518. - PubMed
    1. Auciello FR, Bulusu V, Oon C, Tait-Mulder J, Berry M, Bhattacharyya S, Tumanov S, Allen-Petersen BL, Link J, Kendsersky ND, et al. (2019). A Stromal Lysolipid-Autotaxin Signaling Axis Promotes Pancreatic Tumor Progression. Cancer Discov. 9, 617–627. - PMC - PubMed

Publication types

MeSH terms

Substances

  NODES
innovation 2
Note 3
Project 1
twitter 2