. 2020 Jan 17;12(1):232.
doi: 10.3390/cancers12010232.

Ex-Vivo Treatment of Tumor Tissue Slices as a Predictive Preclinical Method to Evaluate _targeted Therapies for Patients with Renal Carcinoma

Affiliations

Ex-Vivo Treatment of Tumor Tissue Slices as a Predictive Preclinical Method to Evaluate _targeted Therapies for Patients with Renal Carcinoma

Caroline Roelants et al. Cancers (Basel). .

Abstract

Clear cell renal cell carcinoma (ccRCC) is the third type of urologic cancer. At time of diagnosis, 30% of cases are metastatic with no effect of chemotherapy or radiotherapy. Current _targeted therapies lead to a high rate of relapse and resistance after a short-term response. Thus, a major hurdle in the development and use of new treatments for ccRCC is the lack of good pre-clinical models that can accurately predict the efficacy of new drugs and allow the stratification of patients into the correct treatment regime. Here, we describe different 3D cultures models of ccRCC, emphasizing the feasibility and the advantage of ex-vivo treatment of fresh, surgically resected human tumor slice cultures of ccRCC as a robust preclinical model for identifying patient response to specific therapeutics. Moreover, this model based on precision-cut tissue slices enables histopathology measurements as tumor architecture is retained, including the spatial relationship between the tumor and tumor-infiltrating lymphocytes and the stromal components. Our data suggest that acute treatment of tumor tissue slices could represent a benchmark of further exploration as a companion diagnostic tool in ccRCC treatment and a model to develop new therapeutic drugs.

Keywords: drug sensitivity; immune infiltration; renal cancer; _targeted therapy; tumor slice culture.


Conflict of interest statement

The authors declare no financial or commercial conflict of interest.

Figures
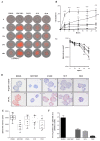
Figure 1
Figure 1
Treatment of 786-O spheroids. 786-O-WT (VHL-) cells were grown as spheroids and treated with 10 µM of either GDC-0941 + saracatinib (10 µM each, GDC/SRC, ▲), pazopanib (PAZO, ), sunitinib (SUN, ◆), temsirolimus (TEM, ●), or vehicle (DMSO, ■) in the presence of propidium iodide. Cell death was monitored on spheroids using either an Essen IncuCyte Zoom live-cell microscopy incubator or by immunohistochemistry. (A) Bright field and fluorescent overlaid images show 786-O-treated spheroids at indicated times (0, 6, 12, 24, and 48 h). Bar scale 300 µm. (B) Images taken automatically every 6 h over 48 h of culture were analyzed for PI fluorescent area quantification. Cell death values (PI labeling area) was divided by the corresponding spheroid area and multiplied by 100. This percentage of cell death was divided by the one at T0, for all the others time points and was expressed as mean ± SEM. The statistical analysis of dead cells was performed with 2 way ANOVA test for each time point compared to DMSO treatment. (C) The same images were analyzed for spheroid area quantification. Significant difference was observed between GDC/SRC (**** p ≤ 0.001), SUN (**** p ≤ 0.01), TEM (**** p ≤ 0.01) versus DMSO after 36 h of treatment using a Kruskal-Wallis test. (D) PCNA staining to visualize proliferation of fixed paraffin-embedded (scale bar, 20 µm). (E) Spheroid area quantification by surface calculation of (D), (n ≥ 8). Significant difference was observed between GDC/SRC (*** p ≤ 0.001), TEM (** p ≤ 0.01) versus DMSO in a Kruskal-Wallis test. (F) The number of PCNA positive cells was quantified in each spheroid and divided by the corresponding spheroid surface. Histogram plot represents mean of PCNA-stained cells pooled from 4 to 6 spheroids (biological replicated/condition) with error bar (±SEM).
Figure 2
Figure 2
The procedure flowchart for renal tumor slice culture. (A) 786-O-derived tumors generated in mouse xenografts or human ccRCC surgical resection specimens are cut into 300 µm slices in buffer solution using a Vibratome®. The slices are transferred to culture medium and then carefully placed on membrane insert in 6-well plates to create an air-liquid interface. After 48 h of drug treatments, slices are analyzed for cell viability and biomarker immuno-detection. Correlation between drug sensitivity and biomarker expression is visualized with the graphical display of a correlation matrix (Corrplot, R package). (B) Tumor slices maintain cell survival over four days of culture. Slices from 786-O-luc-derived tumors were cultured for up to four days, with fresh media changes performed every two days. Each day, luminescence was recorded from slices after luciferin addition using IVIS imaging (upper panel). Plotted normalized photon quantification showed minimal changes over the culture periods.
Figure 3
Figure 3
Treatment of slice cultures from 786-O tumor xenografts. 786-O cells were injected under the renal capsula of Balb/c nude mice. One month later, mice were euthanized, tumors were harvested and processed for tissue slice cultures. (A) Tissue slice cultures were treated with 10 µM of either GDC-0941 + saracatinib (10 µM each, GDC/SRC), pazopanib (PAZO), sunitinib (SUN), temsirolimus (TEM), or vehicle (DMSO 0.2%) for 48 h. Nuclei were stained with Hoechst 33342 and dead cells were visualized by Ethidium homodimer staining. Images were taken with an Apotome-equipped Zeiss microscope. Bar scale 50 µm. (B) The intensity of Ethidium homodimer positive cells was measured in each nucleus on five independent areas of the tumor slices as described in Material and Methods. The y-axis represents the ratio of the percentage of dead cells in the different groups divided by the corresponding value in the DMSO-treated-slices. Significant differences in cell death were observed between DMSO versus the GDC/SRC combination (*** p ≤ 0.001) or each drug alone (** p ≤ 0.05) using a Mann–Whitney test. (C) Tumor slices were treated as described in A, then fixed and embedded in paraffin. Fixed tissue slices were stained with Hematoxylin-Eosin (HE). Representative pictures of treated slices are shown at two magnifications (lower magnifications, upper images and higher magnifications, middle images). Tumor slices were also stained with the anti-PCNA antibody to visualize cell proliferation (lower panel). Negative controls (no primary antibody) are shown in the insets. Scale bars 20 µm.
Figure 4
Figure 4
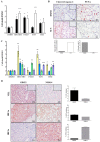
Treatment of slice cultures from human renal tumors. Tissue slice cultures from human renal tumors were treated for 48 h with a panel of drugs (10 µM each) and cell viability assayed as in Figure 3A. (A) Intra-tumor heterogeneity. Two fragments A and B of the same tumor (NM014) were analyzed for their sensitivity to indicated drug treatments. Mean DMSO was normalized to 1 to compare the two fragments of NM014. The y-axis represents the ratio of the percentage of dead cells in the different groups divided by the corresponding value in the DMSO-treated-PDTSC. Cell death measurement in fragment A (black bars) from NM014 shows significant differences between DMSO versus the combination (GDC/SRC, * p < 0.5), pazopanib (PAZO, ** p < 0.01) and temsirolimus (TEM, * p < 0.5) but not versus sunitinib (SUN). The same analysis of fragment B (white bars) from the same NM014 tumor, shows similar profile except for sunitinib that in this case induced significant cell death (SUN, **** p < 0.0005). (B) Apoptosis and proliferation assays. Representative pictures of tumor slices from fragment B of NM014 treated for 48 h with DMSO (upper panels) or 10 µM sunitinib (SUN, lower panels) and stained with Cleaved-Caspase-3 (left panel) or with anti-PCNA antibody (right panel). The PCNA stain identifies cells that are proliferating while the Cleaved-Caspase-3 stain shows cells undergoing apoptosis. The percentages of PCNA and Cleaved-Caspase 3 positive cells were plotted below each set of pictures. Scale bars, 20 µm. Negative controls (no primary antibody) are shown in insets. (C) Inter-tumor heterogeneity. Four different tumors were treated and analyzed as in Figure 3A showing distinct drug sensitivity profiles. Each color represents one patient tumor (Yellow, NB029; Blue, YL024; Green, NM014; Purple, MD034). (D) VHL and HIF expressions. Representative pictures of two untreated tumor slices GD022 and NM014 stained with anti-VHL, anti-HIF1α or anti-HIF2α antibodies. Scale bars, 50 µm. For each staining, images taken from five independent areas of a tumor slice were quantified with ImageJ and plotted as percentage of specific staining relative to tumor area (respective right panels).
Figure 5
Figure 5
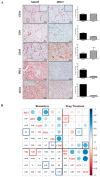
Predictive biomarkers in renal tumor slice cultures. (A) Vascular, immune and stem cell type characterization. Representative pictures of untreated tumor slices ML025 and DP027 stained with the following antibodies: anti-CD34, anti-CD8, anti-CD45, anti-PDL1, anti-LIM1. Scale bars, 50 µm. For each staining, images taken from five independent areas of a tumor slice were quantified with ImageJ and plotted (right panels). (B) Correlation plot between the percentage of positive cells following various IHC staining and the normalized proportion of dying cells following application of drug treatments. The Spearman rank correlation was used. The diagonal indicates the biomarker used for the IHC staining (left part) or the drug treatment (right part). Below the diagonal is the pairwise correlation value, and above the diagonal is the corresponding representation, with the color legend that is the bar on the right side of the plot. Blue (resp. red) colors correspond to positive (resp. negative) correlations. Boxes correspond to cases described in the text. For example, the two blue boxes on the top-left side highlight a correlation of 0.5 of the percentage of positive cells between HIF2 and PDL1 staining.

Similar articles

Cited by

References

    1. Negrier S., Escudier B., Lasset C., Douillard J.Y., Savary J., Chevreau C., Ravaud A., Mercatello A., Peny J., Mousseau M., et al. Recombinant human interleukin-2, recombinant human interferon alfa-2a, or both in metastatic renal-cell carcinoma. Groupe Francais d’Immunotherapie. N. Engl. J. Med. 1998;338:1272–1278. doi: 10.1056/NEJM199804303381805. - DOI - PubMed
    1. Figlin R., Sternberg C., Wood C.G. Novel agents and approaches for advanced renal cell carcinoma. J. Urol. 2012;188:707–715. doi: 10.1016/j.juro.2012.04.108. - DOI - PubMed
    1. Atkins M.B., Clark J.I., Quinn D.I. Immune checkpoint inhibitors in advanced renal cell carcinoma: Experience to date and future directions. Ann. Oncol. Off. J. Eur. Soc. Med Oncol. 2017;28:1484–1494. doi: 10.1093/annonc/mdx151. - DOI - PubMed
    1. Motzer R.J., Penkov K., Haanen J., Rini B., Albiges L., Campbell M.T., Venugopal B., Kollmannsberger C., Negrier S., Uemura M., et al. Avelumab plus Axitinib versus Sunitinib for Advanced Renal-Cell Carcinoma. N. Engl. J. Med. 2019;380:1103–1115. doi: 10.1056/NEJMoa1816047. - DOI - PMC - PubMed
    1. Rini B.I., Plimack E.R., Stus V., Gafanov R., Hawkins R., Nosov D., Pouliot F., Alekseev B., Soulieres D., Melichar B., et al. Pembrolizumab plus Axitinib versus Sunitinib for Advanced Renal-Cell Carcinoma. N. Engl. J. Med. 2019;380:1116–1127. doi: 10.1056/NEJMoa1816714. - DOI - PubMed

LinkOut - more resources

  NODES
Association 1
twitter 2