Category:Earth's atmosphere diagrams
Subcategories
This category has the following 10 subcategories, out of 10 total.
Media in category "Earth's atmosphere diagrams"
The following 154 files are in this category, out of 154 total.
-
Air pressure.svg 744 × 1,052; 2.42 MB
-
Airmassanglp.svg 600 × 480; 17 KB
-
AirmassFormulaePlots.png 1,000 × 695; 547 KB
-
Albedo-Rückstrahlung Infografik.png 1,875 × 1,125; 183 KB
-
Annual-mean global atmospheric heat content anomalies from 1960 to 2020.png 1,257 × 919; 292 KB
-
Astronomy; a section through the earth, showing the atmosphere Wellcome V0024723.jpg 3,654 × 2,952; 2.51 MB
-
Atmopsphera.PNG 411 × 482; 15 KB
-
Atmosfera composizione.svg 744 × 974; 266 KB
-
Atmosfera da Terra.jpg 593 × 417; 36 KB
-
Atmosfera Ziemi.svg 1,336 × 975; 28 KB
-
Atmosferski model.png 770 × 476; 26 KB
-
Atmosphaere.png 1,000 × 573; 76 KB
-
Atmosphere composition diagram-en.svg 2,494 × 2,189; 295 KB
-
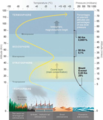
Atmosphere layers, temperature and airborne emission sources.png 504 × 588; 322 KB
-
Atmosphere Model Persian.svg 770 × 476; 37 KB
-
Atmosphere Model-Persian.png 770 × 476; 15 KB
-
Atmosphere model.png 770 × 476; 8 KB
-
Atmospheric extinction curve.png 640 × 480; 6 KB
-
Atmospheric ozone es.svg 1,206 × 688; 173 KB
-
Atmospheric Ozone Rus.svg 1,280 × 640; 53 KB
-
Atmospheric ozone ukr.svg 1,162 × 688; 357 KB
-
Atmospheric ozone.svg 1,200 × 700; 19 KB
-
Atmospheric radiation.png 637 × 380; 62 KB
-
Atmospheric-Ozone.png 1,163 × 688; 30 KB
-
Atmosphère évolution.jpg 843 × 728; 153 KB
-
Balanced-flow-speeds.PNG 954 × 674; 47 KB
-
Barometric formula2.png 1,141 × 731; 14 KB
-
Boltzmann.png 748 × 446; 16 KB
-
Breakdown of the incoming solar energy-ar.svg 800 × 580; 19 KB
-
Carbon-Slicate Cycle Feedbacks.jpg 846 × 951; 114 KB
-
Cartaz Atmosfera terrestre.png 1,587 × 2,245; 1.98 MB
-
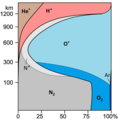
Chemical composition of atmosphere accordig to altitude.png 768 × 783; 96 KB
-
Column atmosphere of Earth 02.svg 1,024 × 1,720; 492 KB
-
Column atmosphere of Earth text pt 02.svg 1,024 × 1,720; 403 KB
-
Column atmosphere of Earth text pt.png 610 × 1,024; 132 KB
-
Column atmosphere of Earth.png 610 × 1,024; 234 KB
-
Combustión del azufre.svg 744 × 1,052; 12 KB
-
Combustión N2.svg 744 × 1,052; 32 KB
-
Comparison US standard atmosphere 1962 mk.svg 512 × 632; 230 KB
-
Comparison US standard atmosphere 1962-ru.svg 1,088 × 1,343; 8 KB
-
Comparison US standard atmosphere 1962.svg 512 × 632; 21 KB
-
Cosmic rays Infographics.svg 744 × 1,052; 2.3 MB
-
Counterrad Oct2005 100dpi de.png 880 × 633; 26 KB
-
Counterrad Oct2005 100dpi en.png 880 × 633; 25 KB
-
Earth Atmosphere (পৃথিবীর বায়ুমণ্ডল).svg 616 × 602; 458 KB
-
Earth Global Circulation - de.svg 944 × 763; 144 KB
-
Earth Global Circulation - en.svg 950 × 770; 154 KB
-
Earth Global Circulation - eu.svg 512 × 415; 75 KB
-
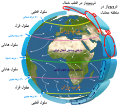
Earth Global Circulation - fa.svg 910 × 801; 892 KB
-
Earth Global Circulation - no.svg 950 × 770; 147 KB
-
Earth Global Circulation - ru.svg 1,050 × 800; 146 KB
-
Earth Global Circulation2-no.svg 950 × 770; 140 KB
-
Earth-crust-cutaway-pt.svg 995 × 684; 27 KB
-
Eej obs.png 706 × 529; 7 KB
-
Eliminación de Ozono por CFC.svg 744 × 1,052; 41 KB
-
EMP mechanism.png 618 × 729; 48 KB
-
EMP USA.svg 914 × 840; 166 KB
-
Erdatmosphäre Aufbau.jpg 188 × 1,000; 124 KB
-
EST airglow-01 resized.jpg 3,000 × 1,688; 4.24 MB
-
Example Plot of Umkehr curve..tif 1,700 × 2,200; 10 KB
-
Exospherelayer.gif 120 × 122; 3 KB
-
Exospherlayer.png 120 × 122; 2 KB
-
Fichier-AtmosphericMethaneSouthAmérica.jpg 665 × 301; 80 KB
-
FluxoCO2 diario.gif 572 × 416; 4 KB
-
Formación de Ácido Nítrico por Ozono troposférico.svg 744 × 1,052; 45 KB
-
Forzamiento radiativo - Radiative-forcings-es.svg 600 × 480; 73 KB
-
Geruzak.png 512 × 415; 158 KB
-
Geçiş irtifası, FL, QNE, QNH ve QFE.png 1,200 × 800; 355 KB
-
GMCdiagram.jpg 1,506 × 687; 264 KB
-
Greenhouse gas trends.jpg 1,860 × 455; 178 KB
-
HadleyCross-sec es.PNG 396 × 238; 49 KB
-
Halogene Chemistry in the Atmosphere.png 2,062 × 771; 317 KB
-
Hemispherical photography canopy manual rich 1989.pdf 1,275 × 1,650, 92 pages; 1.23 MB
-
Ionospheric absorption (en).svg 332 × 274; 24 KB
-
Isothermal atmosphere.jpg 378 × 292; 18 KB
-
Isothermal-barotropic atmosphere model.png 600 × 300; 4 KB
-
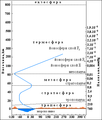
Layers of atmosphere (PSF).png 2,377 × 4,648; 451 KB
-
Layers of the Atmosphere (29796720046).jpg 2,000 × 3,100; 2.64 MB
-
LidarAtmospherique.png 1,190 × 559; 70 KB
-
Liquid ocean atmosphere model.png 399 × 300; 3 KB
-
Luft im Teilchenmodell.svg 708 × 708; 78 KB
-
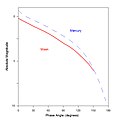
Mars phase curve.jpg 717 × 692; 80 KB
-
Medidas.gif 640 × 350; 101 KB
-
Mesoproterozoic temperature.jpg 1,992 × 1,408; 204 KB
-
MethaneSinkPieChart.jpg 233 × 192; 9 KB
-
Mezospherelayer.png 120 × 85; 4 KB
-
Mida aerosol atmosfèric.jpg 520 × 580; 105 KB
-
Model of a planet with atmosphere.svg 744 × 1,052; 35 KB
-
Modelo atmosférico global.png 650 × 439; 204 KB
-
Moon Phase Curve 5.jpg 686 × 703; 63 KB
-
MSA.PNG 629 × 467; 13 KB
-
Msis atmospheric composition by height.svg 600 × 480; 33 KB
-
Nadoblačný blesk.png 1,299 × 1,034; 412 KB
-
Nomenclature of Thermosphere.jpg 980 × 600; 346 KB
-
Optinv.png 529 × 538; 7 KB
-
Ozone cycle vi.png 1,024 × 724; 120 KB
-
Ozone cycle-gu.svg 1,122 × 777; 37 KB
-
Ozone cycle-HU.svg 1,052 × 744; 34 KB
-
Ozone cycle.svg 1,052 × 744; 33 KB
-
Ozone depletion.png 640 × 480; 28 KB
-
Paramètres qui guident le destin de l'athmosphère.png 1,232 × 722; 40 KB
-
Phase Angle 3.jpg 574 × 403; 38 KB
-
Phase Angle 3.svg 574 × 403; 33 KB
-
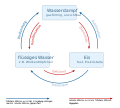
Phasenübergänge des Wassers (Energieumsätze).svg 1,000 × 900; 162 KB
-
Podział atmosfery.svg 360 × 1,000; 21 KB
-
Pressione idrostatica dell'aria.png 800 × 588; 91 KB
-
Pressure air-ru.svg 512 × 279; 2 KB
-
Pressure air.svg 549 × 301; 79 KB
-
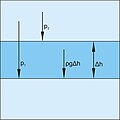
Pressure water air (de).svg 770 × 350; 172 KB
-
Pressure water air (en).svg 770 × 350; 181 KB
-
PSM V09 D320 Atmospheric currents.jpg 1,751 × 1,448; 186 KB
-
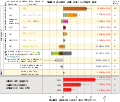
Radiacni pusobeni AR5.svg 636 × 540; 80 KB
-
Radiacni pusobeni od roku 1750.svg 589 × 389; 132 KB
-
Radiacni pusobeni.svg 600 × 480; 58 KB
-
Radiative-forcings-da.svg 600 × 480; 51 KB
-
Radiative-forcings-hu.svg 600 × 480; 59 KB
-
Radiative-forcings-ja.svg 600 × 480; 46 KB
-
Radiative-forcings-no.svg 600 × 480; 51 KB
-
Radiative-forcings-zh.svg 600 × 480; 46 KB
-
Radiative-forcings.es.svg 600 × 480; 56 KB
-
Radiative-forcings.svg 600 × 480; 48 KB
-
Rayonnement solaire.svg 800 × 600; 41 KB
-
Reaction peroxynitrite.png 972 × 500; 13 KB
-
Rohabgas.png 653 × 454; 59 KB
-
Seasons af.png 1,280 × 818; 91 KB
-
SO2 Ácido sulfúrico.svg 744 × 1,052; 37 KB
-
Solar spectrum cs.svg 800 × 600; 47 KB
-
Solar spectrum en.svg 800 × 600; 49 KB
-
Solar spectrum es.svg 800 × 600; 47 KB
-
Solar spectrum pt.svg 800 × 600; 54 KB
-
Spectroscopic Analysis of Three Planets (4183-Image).png 4,000 × 2,545; 2.38 MB
-
Stratospherelayer.png 120 × 79; 3 KB
-
Struktura spodní atmosféry.jpg 1,740 × 1,074; 165 KB
-
Termospherelayer.png 120 × 79; 5 KB
-
The distribution of the temperature.svg 744 × 1,052; 25 KB
-
Thermospherewaves.jpg 1,000 × 660; 504 KB
-
Transport of VSLS.png 640 × 480; 22 KB
-
Trapospherelayer.png 120 × 336; 17 KB
-
Troposphaerische.Laengen.png 1,680 × 480; 28 KB
-
Viewing angle and air masses (reduced).svg 600 × 480; 42 KB
-
Viewing angle and air masses.svg 600 × 480; 35 KB
-
Wave group and microbarom.png 1,559 × 527; 292 KB
-
Why the sky looks darker on top.png 400 × 600; 135 KB
-
World in Ray.svg 744 × 1,052; 2.4 MB
-
Zmiany cisnienia.jpg 1,895 × 1,895; 120 KB
-
Zuurstofcrisis or Great Oxidation Event.png 2,766 × 1,768; 585 KB
-
השוואה בין הנוסחאות הברומטריות.png 640 × 480; 32 KB
-
世界平均放射強制力.png 1,354 × 1,354; 103 KB


