Category:Economic maps of India
Subcategories
This category has the following 6 subcategories, out of 6 total.
A
- Agricultural maps of India (16 F)
E
G
- GDP maps of India (18 F)
H
- HDI maps of India (25 F)
P
- Poverty maps of India (3 F)
T
Media in category "Economic maps of India"
The following 57 files are in this category, out of 57 total.
-
2006Indian exports.PNG 1,425 × 625; 61 KB
-
2010 India forest cover distribution map for its States and Union Territories.svg 1,578 × 1,738; 863 KB
-
2012 Poverty distribution map in India by its states and union territories.svg 1,578 × 1,738; 823 KB
-
Amritsar Kolkata Industrial Corridor (AKIC) Map.jpg 730 × 580; 56 KB
-
Bengaluru Mumbai Industrial Corridor (BMIC) Map.jpg 730 × 580; 41 KB
-
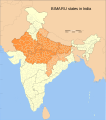
BIMARU.svg 1,643 × 1,856; 837 KB
-
Chennai Bengaluru Industrial Corridor (CBIC) Map.jpg 730 × 580; 41 KB
-
Corruption perceptions distribution in Indian states 2005 map.svg 1,578 × 1,738; 862 KB
-
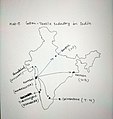
Cotton textile industry in India.jpg 646 × 683; 157 KB
-
Delhi Mumbai Industrial Corridor (DMIC) Map.jpg 730 × 580; 61 KB
-
Delhi Nagpur Industrial Corridor (DNIC) Map.jpg 730 × 580; 53 KB
-
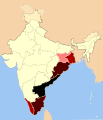
ECEC map.jpg 495 × 376; 41 KB
-
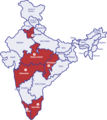
ESAF Geographical Coverage in India.png 1,368 × 1,538; 268 KB
-
Extension of CBIC to Kochi Map.jpg 730 × 580; 23 KB
-
Fj6lkeOaMAE-8sm.jpg 2,160 × 2,160; 491 KB
-
Hyderabad Bengaluru Industrial Corridor (HBIC) Map.jpg 730 × 580; 29 KB
-
Hyderabad Nagpur Industrial Corridor (HNIC) Map.jpg 730 × 580; 45 KB
-
Hyderabad Warangal Industrial Corridor (HWIC) Map.jpg 730 × 580; 46 KB
-
ICAI Regional Councils.png 650 × 875; 796 KB
-
Ind world GNI percapita.PNG 1,480 × 625; 59 KB
-
Index of Corruption by Indian states in 2005.png 624 × 704; 98 KB
-
India - Manganese Ore Shipment - DPLA - f095b54426226115056074e2adec8451.jpg 4,329 × 4,001; 1.92 MB
-
India - Metallurgical and Refractory Plants - DPLA - 83c3f5949750544cafd899e06bf8af6a.jpg 5,844 × 6,930; 3.96 MB
-
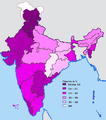
India decadal growth rate map en.svg 1,639 × 1,852; 876 KB
-
India GSDP.png 10,000 × 11,382; 1.76 MB
-
India mineral map.jpg 660 × 942; 198 KB
-
India-locator-map-thorium.svg 1,486 × 1,734; 428 KB
-
India-locator-map-thorium2012.svg 1,486 × 1,734; 456 KB
-
India-locator-map-thorium2016.svg 1,486 × 1,734; 396 KB
-
Indian States and Union Territories by HDI 2022.png 3,818 × 4,600; 772 KB
-
Indian States and Union Territories by HDI as of 2022.png 3,818 × 4,600; 770 KB
-
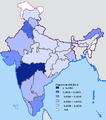
Indian states and union territories by NSDP per capita.png 3,818 × 4,600; 945 KB
-
Indian states as countries with similar Nominal GDP.png 1,486 × 1,734; 350 KB
-
Indian states by poverty in percentage (1999-2000).png 624 × 704; 98 KB
-
Lemon Tree Hotels.GIF 576 × 645; 25 KB
-
Map of Indian Handlooms, 1985, Crafts Museum, New Delhi, India.jpg 2,504 × 3,420; 4.33 MB
-
National Industrial Corridor (NIC) Map of India.jpg 2,480 × 3,508; 824 KB
-
Nominal NSDP per capita (₹) of Indian states & UTs (1).png 3,818 × 4,600; 1,019 KB
-
Odisha Economic Corridor (OEC) Map.jpg 730 × 580; 58 KB
-
Per capita BIP in Bihar 2011-12.svg 512 × 372; 350 KB
-
Per capita NSDP in India (1997-98).png 624 × 704; 129 KB
-
Per capita NSDP in India (1997-98).svg 1,594 × 1,868; 287 KB
-
Poverty Rates in India 2022 23.png 3,818 × 4,600; 1.2 MB
-
Pro-Kopf-Bruttosozialprodukt in Indien 2011.svg 824 × 929; 946 KB
-
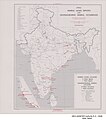
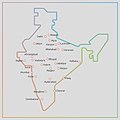
Sub Regional Economic Cooperation Zones.gif 1,320 × 1,400; 92 KB
-
Tikona COVERAGE.jpg 550 × 550; 86 KB
-
Uttarpradesh-industrial-map.jpg 600 × 586; 93 KB
-
Vizag Chennai Industrial Corridor (VCIC) Map.jpg 730 × 580; 35 KB
-
WFP FOOD.png 2,479 × 1,753; 350 KB
-
Wp-1697540723847.webp 1,280 × 808; 118 KB
-
Índia - Industria e ressorsas naturalas principalas.png 676 × 792; 135 KB


