Category:Speciation diagrams
Graph of concentrations of different species of a polyprotic acid, as a function of pH, when the solution is at equilibrium | |||||
| Upload media | |||||
| Named after |
| ||||
|---|---|---|---|---|---|
| |||||
Media in category "Speciation diagrams"
The following 25 files are in this category, out of 25 total.
-
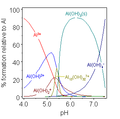
Al hydrolysis speciation diagram.png 304 × 302; 5 KB
-
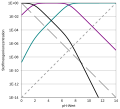
Al hydrolysis.svg 1,133 × 749; 64 KB
-
Allopatric speciation caused by topography.svg 3,711 × 1,474; 125 KB
-
AnteileDerKohlensäureformen.svg 1,097 × 1,048; 7 KB
-
Carbonate Bjerrum.gif 462 × 290; 9 KB
-
Carbonate system of seawater.svg 540 × 334; 23 KB
-
Differential flower visitiation by pollinators - Graph.svg 2,862 × 1,422; 42 KB
-
Ecological vs Non-Ecological Speciation.svg 1,785 × 2,211; 226 KB
-
Efecto Wallace.png 1,733 × 642; 647 KB
-
Flower color and nectar volume as a function of pollinator species ranges.svg 2,991 × 1,671; 82 KB
-
Hägg-Diagramm Essigsäure.svg 474 × 429; 13 KB
-
Hägg-Diagramm Kohlensäure.svg 474 × 429; 15 KB
-
Hägg-Diagramm Phosphorsäure.svg 474 × 429; 16 KB
-
Hägg-Diagramm Schwefelsäure.svg 474 × 429; 14 KB
-
Hägg-Diagramm Schwefelwasserstoff.svg 474 × 429; 14 KB
-
Hägg-Diagramm Schweflige Säure.svg 474 × 429; 14 KB
-
Mécanisme spéciation allopatrique.png 1,920 × 671; 84 KB
-
Phosphoric3.png 309 × 300; 2 KB
-
PiSpeciation mk.svg 719 × 428; 181 KB
-
PiSpeciation.svg 719 × 428; 130 KB
-
Post-Zygotic Ecological Isolation.svg 2,044 × 2,289; 277 KB
-
Speciation-Animation-13-hypothetical-generations.gif 1,000 × 500; 366 KB
-
Species 01a es.png 1,218 × 1,545; 17 KB
-
Three-dimentional differentiation space for speciation.svg 3,516 × 2,384; 262 KB


