- Affected metrics
- RUM Median story
- RUM p95 story
- WebPageTest story
- ResourceLoader traffic affected
Affected metrics
NavigationTiming metrics around September 8th:
(Links to Grafana viewing from 20160801 to 20160918)
| Metric | Difference | Graph |
|---|---|---|
| responseStart | unaffected | - |
| domInteractive (From navigationStart to document received, parsed, and blocking resources ready) | Median: -50ms (from 870ms to 820ms) | - |
| p95: -6% (4.5s to 4.2s) | - | |
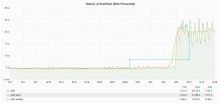
| firstPaint | Median: unaffected (~1000ms) | |
| p95: +441% (from 4.9s to 21.6s) | ||
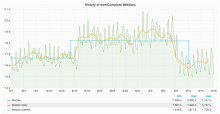
| domComplete | Median: -20% (from 1900ms to 1500ms) | |
| p95: -8% (from 9.4s to 8.7s) | - | |
| loadEventEnd | Median: -25% (from 2000ms to 1600ms) | |
| p95: -10% (from 10s to 9s) | - | |
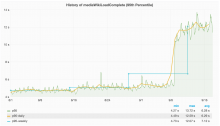
| mediaWikiLoadComplete (Time startup.js loaded execution and NavTiming module being loaded) | Median: +400ms (from 900ms to 1300ms) | |
| p95: +100% (from 5s to 10s) | ||
RUM Median story
Before:
| 0s | .. | 870ms | 1000ms | .. | 1900ms | 2000ms | |
| Navigation Timing | navigationStart | domInteractive | firstPaint | domComplete | loadEvent | ||
| MediaWiki | mediaWikiLoadStart | ..(+900ms) | mediaWikiLoadEnd | ||||
After:
| 0s | .. | 820ms | 1000ms | .. | 1500ms | 1600ms | |
| Navigation Timing | navigationStart | domInteractive | firstPaint | domComplete | loadEvent | ||
| MediaWiki | mediaWikiLoadStart | ..(+1300ms) | mediaWikiLoadEnd | ||||
For the median use case it seems like events mostly re-ordered, in a way that ultimately actually makes the page finish loading quicker. Assuming that this is caused by "resourceloader: Make cache-eval asynchronous ", it happened by letting the browser prioritise getting the page ready, on-screen and interactive; in favour of spreading out module execution.
RUM p95
Before:
| 0s | .. | 4.5s | 4.9s | .. | 9.4s | 10s | |
| Navigation Timing | navigationStart | domInteractive | firstPaint | domComplete | loadEvent | ||
| MediaWiki | mediaWikiLoadStart | ..(+5s) | mediaWikiLoadEnd | ||||
After:
| 0s | .. | 4.2s | 8.7s | 9s | .. | 21.6s | |
| Navigation Timing | navigationStart | domInteractive | domComplete | loadEvent | firstPaint | ||
| MediaWiki | mediaWikiLoadStart | ..(+10s) | mediaWikiLoadEnd | ||||
Here too overall page load is faster. But JS execution is spread out even more. This could be due to various reasons. The most likely reasons is a combination of the following three reasons.
- requestIdleCallback in chrome causing a delay upto 30s (fixed in master)
- setTimeout being deprioritized in background tabs (probably acceptable and desirable; not sure if a significant amount of page views initialise in a background tab and/or pre-render).
- Cache-eval goes in chunks of 50ms. On slower devices (e.g. mobile) will require a lot of chunks, compared to the previous approach of executing everything in one go. However the downside is that this will render the user's browser unresponsive for a long time - which is arguably a much worse user experience. To be confirmed.
WebPageTest
https://grafana.wikimedia.org/dashboard/db/webpagetest-drilldown
(user: Anonymous, project: enwiki, page: Facebook)
Desktop first view:
- SpeedIndex: Unaffected.
- Start render:
- us-east1/Firefox: Consistently hitting the low-end more frequently (range unchanged).
- us-east1/Chrome: Range is consistently 100ms lower.
- us-east1/IE: Unchanged.
- Fully loaded:
- us-east1/Firefox: Unchanged.
- us-east1/Chrome: Consistently 100ms lower.
- us-east1/IE: Unchanged.
- mwLoadStart/mwLoadEnd
- Firefox: Unchanged.
- Chrome: Consistently ends 100ms earlier.
- IE: No clear change.
Desktop repeat view (Chrome only):
https://grafana.wikimedia.org/dashboard/db/webpagetest-drilldown?var-view=repeatView
- SpeedIndex: 1.2s -> 800ms.
- Start render: 790ms -> 570ms.
- Fully loaded: 2.6s -> 2.3s.
Real Mobile (Motorola G, 3G-Fast):
https://grafana.wikimedia.org/dashboard/db/webpagetest-drilldown?panelId=22&fullscreen
- SpeedIndex: About 200 lower on average
- fullyLoaded: No clear change.
- mwLoadStart/End: No clear change.
- render: No clear change.
Second page view (Chrome, emulateMobile):
https://grafana.wikimedia.org/dashboard/db/webpagetest-drilldown?panelId=26&fullscreen
- SpeedIndex: -100 (2014 -> 1930)
- render: -100 (1990 -> 1891)
- fullyLoaded: +300ms (2.1s -> 2.4s)
- mwLoadStart: +/-0 (210ms)
- mwLoadEnd: +200ms (2.4s -> 2.6s)
ResourceLoader traffic affected
In addition, it appears ResourceLoader traffic was also affected in interesting ways.
https://grafana.wikimedia.org/dashboard/db/resourceloader?from=1472080149720&to=1474672149720
Detail:
https://grafana.wikimedia.org/dashboard/db/resourceloader?from=1473339406287&to=1473486088050
On September 8 between 18:45 and 19:15 there was a very sudden increase in total traffic to load.php. Most of these extra requests had an If-None-Match header, and were responded to with HTTP 200 and a short cache-expiry.
Log entries confirm that this is indeed also caused by the async cache-eval change:
19:02 logmsgbot: demon@tin rebuilt wikiversions.php and synchronized wikiversions files: group2 to wmf.18


