Page MenuHomePhabricator

Profile Performance of LocalStorage-based and client-side cookie-based User Preference Storage
Closed, ResolvedPublic

Assigned To
Authored By
NBaca-WMF
Jan 24 2023, 3:49 PM
Referenced Files
F36511052: after-mobile-script.png
Jan 26 2023, 1:41 AM
F36511050: before-mobile-script.png
Jan 26 2023, 1:41 AM
F36487166: after-site-speed-io.png
Jan 25 2023, 12:30 AM
F36487163: before-site-speed-io.png
Jan 25 2023, 12:30 AM
F36487129: after-task.png
Jan 24 2023, 11:39 PM
F36487126: before-task.png
Jan 24 2023, 11:39 PM
F36486373: profile-after.png
Jan 24 2023, 8:13 PM
F36486371: profile-before.png
Jan 24 2023, 8:13 PM

Description

As part of our fix for https://phabricator.wikimedia.org/T321498 , we introduced a LocalStorage-based user preferences persistence mechanism.

As noted in prior discussions, until we discuss this further, this is meant to be an immediate-term fix for the needs associated with this single preference setting. As such, our goal is to understand and mitigate risk associated with this fix until we have a more sustainable longer-term solution.

With this in mind, we should profile the performance of the relevant patchset for this fix (see https://gerrit.wikimedia.org/r/c/mediawiki/core/+/881728 ) , with preferences enabled and disabled, to better understand the performance implications of this current fix.

Coming out of this analysis, we should be able to say "this is not so bad because metrics XYZ are impacted in ways ABC", or "this is not acceptable given impact DEF".

Acceptance Criteria

Per the performance team's recommendation at https://gerrit.wikimedia.org/r/c/mediawiki/core/+/882758/2#message-c05fce98d86aeced6252440b395828fd982caf91:

  • Profile changes locally with a 6x CPU throttle to get a rough idea of impact
  • Enable feature flag for small wikis (e.g. mediawiki.org, cawiki) and look at impact of synthetic tests
  • Deploy everywhere and measure impact of navigation timing dashboard

Event Timeline

Profiling the local storage strategy

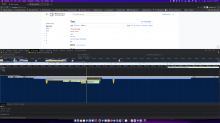
I profiled the local storage (patches 881728, 845667) on my local machine (MacBook Pro M1) using a 6x CPU throttle in incognito mode to get a very rough idea of the impact of using the local storage strategy.

I used performance.mark before the call to if ( $config->get( MainConfigNames::SkinClientPreferences ) && $isAnon ) so that I could identify the inline script task more easily. Then, I profiled a page load setting $wgSkinClientPreferences = false compared to a page load setting $wgSkinClientPreferences = true;. I then identified the task in the main thread responsible for executing the inline script.

$wgSkinClientPreferences = false

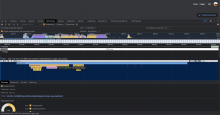
profile-before.png (2×5 px, 1 MB)

Total task time: 9.83 ms . No forced synchronous layouts present in task.

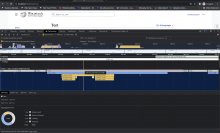
$wgSkinClientPreferences = true

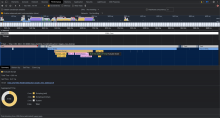
profile-after.png (2×5 px, 1 MB)

Total task time: 11.53 ms . No forced synchronous layouts present in task.

Differences observed

Although the local storage feature was about 1.7ms longer, it is still well under the 50ms cut-off to be considered a long task.

It's important to note that this was only measured on my (powerful) machine with a heavy throttle to simulate lower-end devices. It's only meant to serve as a very rough approximation. I expect these results to look different when run on other devices.

However, I did not identify anything in the profile that blocks the next step of this process - "Enable feature flag for small wikis (e.g. mediawiki.org, cawiki) and look at impact of synthetic tests".

Profiling the client-side cookie strategy

I profiled the local storage (patches 881728, 845667) on my local machine (MacBook Pro M1) using a 6x CPU throttle in incognito mode to get a very rough idea of the impact of using the client-side cookie strategy.

I used performance.mark before the conditional if ( $config->get( MainConfigNames::ResourceLoaderClientPreferences ) && $isAnon ) { so that I could identify the inline script task more easily. Then, I profiled a page load setting $wgSkinClientPreferences = false compared to a page load setting $wgSkinClientPreferences = true;. I then identified the task in the main thread responsible for executing the inline script.

$wgResourceLoaderClientPreferences = false

before-task.png (2×3 px, 599 KB)

Total task time: 8.67 ms . No forced synchronous layouts present in task.

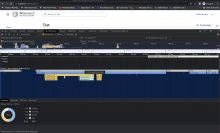
$wgResourceLoaderClientPreferences = true

after-task.png (2×3 px, 584 KB)

Total task time: 10.56 ms . No forced synchronous layouts present in task.

Differences observed

Although the cookie strategy's inline script task took about 1.89ms longer, it is still well under the 50ms cut-off to be considered a long task.

It's important to note that this was only measured on my (powerful) machine with a heavy throttle to simulate lower-end devices. It's only meant to serve as a very rough approximation. I expect these results to look different when run on other devices.

However, I did not identify anything in the profile that blocks the next step of this process - "Enable feature flag for small wikis (e.g. mediawiki.org, cawiki) and look at impact of synthetic tests".

Jdlrobson renamed this task from Profile Performance of LocalStorage-based User Preference Storage to Profile Performance of LocalStorage-based and cookie-based User Preference Storage.Jan 25 2023, 12:20 AM
Jdlrobson renamed this task from Profile Performance of LocalStorage-based and cookie-based User Preference Storage to Profile Performance of LocalStorage-based and client-side cookie-based User Preference Storage.
Jdlrobson moved this task from Doing to Ready for Signoff on the Web-Team FY2022-23 Q3 Sprint 1 board.
Jdlrobson subscribed.

Thanks @nray ! Leaving open for a bit for any follow up discusson.

Using sitespeed.io to measure client-side cookie strategy

I also thought it would be interesting to see if sitespeedio detected any major regression with the client-side cookie strategy. I ran the docker run --rm -v "$(pwd):/sitespeed.io" sitespeedio/sitespeed.io:26.1.0 http://host.docker.internal:8080/wiki/Test command with the feature flag off/on and compared the differences:

$wgResourceLoaderClientPreferences = false

Results of report: https://before-profile-cookie.netlify.app/

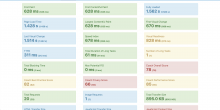
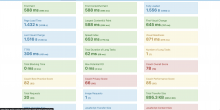
before-site-speed-io.png (1×3 px, 483 KB)

$wgResourceLoaderClientPreferences = true

Results of report: https://after-profile-cookie.netlify.app/

after-site-speed-io.png (1×3 px, 515 KB)

Differences observed

First paint, first contentful paint, fully loaded, speed index, and HTML transfer size were all fairly similar. I didn't identify anything that would block the next step of the process - "Enable feature flag for small wikis (e.g. mediawiki.org, cawiki) and look at impact of synthetic tests".

Hi @nray cool, thanks for testing it out! There's a couple of things I'm thinking about: perfect that you looked in devtools and use the cpu slowdown (the cpu slowdown works as it should vs the network slowdown in devtools ín Chrome sucks :).

For the 50 ms limit on when a task is a long task: my thinking is that when you have a 50 ms slowdown scrolling/clicking can be janky depending on when it happens and the 50 ms depends on what CPU our device has, so its a good way to try slowdown the CPU as you did. We measure the CPU speed from some of our users and I've been using those metrics to try calibrate our test phones to match our 75/95p users. However I haven't done the same yet on desktop, but will do when we move the tests to bare metal. When we have that I have pretty good confidence our numbers will match our users.

So ... what I wanted to say is that I think in our new case loading the preferences before start rendering the 50 ms limit isn't a good threshold, since every X ms here will postpone rendering by at least X. It's complicated with how the page render, a small delay early on, can make bigger difference later on when the page render. It's a complicated puzzle. For example I've seen that we have had test where we test the exact same thing and the difference in rendering can be 0.5-1 second and it depends on when the browser chooses to parse and execute CSS/JS. That's why I think its important to look at the full picture (like waterfalls and others metrics), lets do that together the next time we something we wanna try out.

The way we've been doing that is to push the change to our production servers in static directory where we create version of what we want to try and then we point our measuring tools to it (like sitespeed.io). That way we are measuring it in more realistic scenario (our servers are serving the content) and we can let sitespeed.io run a standalone server so we can minimise the noise. That's the best way to do it today, but we want to make it easier so you can test yourself in a stable environment in a really easy way and T285203 is a way forward for that.

Thank you for the info @Peter!

I also have a 2 GHz / 2 GB RAM Xiaomi Redmi 9A phone (costs under $100) that I sometimes like to use for profiling to get a better idea of how low-powered devices respond. I was curious how this compared to my profile using my MacBook Pro M1 with a 6x CPU throttle and again found minor differences in the script execution - 5.37ms vs. 6.03ms with the feature flag off vs. on, respectively (and using the desktop view to see vector-2022 on my phone).

before-mobile-script.png (1×3 px, 413 KB)

after-mobile-script.png (1×3 px, 378 KB)

Also, thank you for mentioning the 50ms threshold. I agree that this case is unique because of how far upstream it occurs, and that probably isn't the best threshold to use in this situation. Still, I've only seen minor differences in each profile I've looked at which makes me think that it's reasonable to enable the feature on group 0 wikis and monitor the synthetic tests/RUM metrics as a next step.

nray subscribed.
  NODES
HOME 1
Idea 4
idea 4
Interesting 1
Intern 1
mac 7
Note 4
os 8
server 3
Users 4
web 7