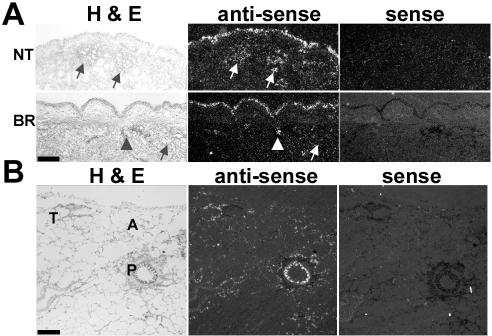
Figure 1.
CFTR mRNA expression in normal human airways. Representative results from CFTR ISH analyses of (A) nasal turbinate (NT, n = 4) and bronchial (BR, n = 5) epithelia and (B) distal lung (n = 3). Bright field (H&E, left) and dark field (center) of a tissue section labeled with antisense probe, and dark field of a consecutive tissue section labeled with sense probe (right) are shown. Tissues were exposed to radiosensitive emulsion for 30 d (A) and 60 d (B). Both, nasal and bronchial specimens exhibited stronger and more consistent ISH signal in the surface epithelium than in submucosal gland acini. Some gland acini (arrows), ciliated ducts (arrowheads), proximal (P) and terminal (T) bronchioles, and alveoli (A) are identified; bar, 1 mm.

