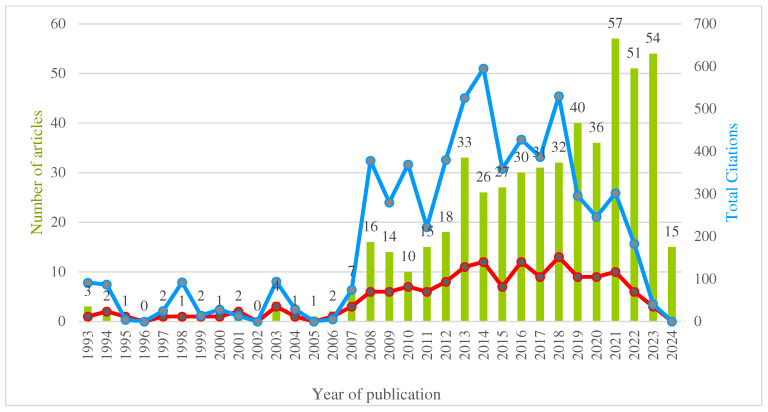
Figure 1.
Time intervals of cited articles. Green bars represent the number of publications per year, the blue line represents the number of citations per article per year, and the red line represents the H-index by year. The distribution of articles and total number of citations by year is shown in the figure.

