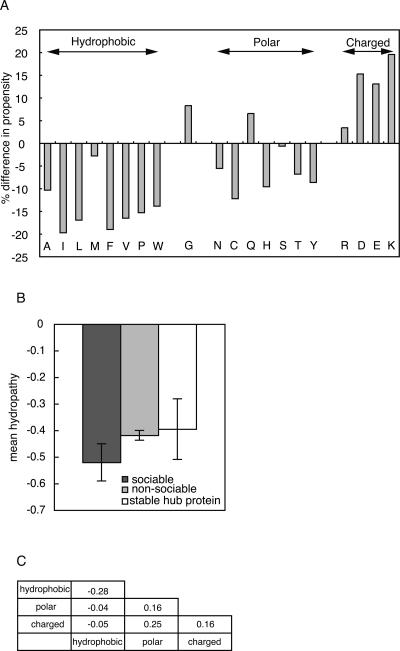
Figure 4.
Comparison of sequence propensity between sociable and nonsociable proteins. (A) Percent differences in amino acid propensities are shown. Amino acid names are shown in one-letter codes at the bottom. (B) Mean hydropathy values are shown for sociable (black bar), nonsociable (gray bar), and stable hub proteins (white bar), respectively. Error bars indicate the 95% confidence intervals of the mean values. (C) Observed frequency ratios of atom contacts in sociable and nonsociable proteins in the natural logarithmic scale.

