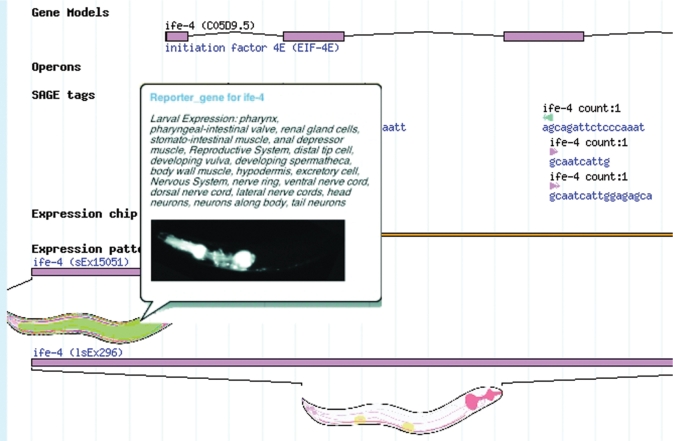
Figure 2.
Expression details of ife-4 shown in genome browser. Cartoon worms show approximate expression location. Mouse over pop-up window (left-center box) gives more details and original image. SAGE tags shown as blue/pink triangles with tag sequence and count. Sequences used in microarray experiments shown as horizontal, orange bar which can be clicked for more details. Gene exons displayed as pink boxes.

