Abstract
Although the role of APP and PSEN genes in genetic Alzheimer's disease (AD) cases is well established, fairly little is known about the molecular mechanisms affecting Aβ generation in sporadic AD. Deficiency in Aβ clearance is certainly a possibility, but increased expression of proteins like APP or BACE1/β-secretase may also be associated with the disease. We therefore investigated changes in microRNA (miRNA) expression profiles of sporadic AD patients and found that several miRNAs potentially involved in the regulation of APP and BACE1 expression appeared to be decreased in diseased brain. We show here that miR-29a, -29b-1, and -9 can regulate BACE1 expression in vitro. The miR-29a/b-1 cluster was significantly (and AD-dementia-specific) decreased in AD patients displaying abnormally high BACE1 protein. Similar correlations between expression of this cluster and BACE1 were found during brain development and in primary neuronal cultures. Finally, we provide evidence for a potential causal relationship between miR-29a/b-1 expression and Aβ generation in a cell culture model. We propose that loss of specific miRNAs can contribute to increased BACE1 and Aβ levels in sporadic AD.
Keywords: neurodegeneration, amyloid, noncoding RNA
Mutations in the APP and PSEN genes cause Aβ accumulation and familial Alzheimer's disease (AD) (1–4). However, little is known about the mechanisms that contribute to Aβ accumulation in the vast majority of sporadic AD cases. BACE1/β-secretase cleavage of APP is the rate-limiting step for Aβ peptide production. Increased BACE1 expression is observed in patients with sporadic AD (5–8), and several mechanisms for this up-regulation have been proposed (9, 10). A link between BACE1 levels, Aβ load, and AD pathology has been reported (11), suggesting that increased BACE1 expression is indeed an important risk factor for sporadic AD.
miRNAs are small noncoding RNAs that control gene expression at the posttranscriptional level by binding to the 3′ untranslated region (3′UTR) of _target mRNAs leading to their translational inhibition or sometimes degradation. Several miRNAs are specifically expressed or enriched in the brain (12–15), and some have been associated with neuronal differentiation, synaptic plasticity, and memory formation (16, 17). The hypothesis that miRNA pathways could contribute to neurodegeneration is appealing (18) and has been tested to a certain degree in Drosophila (19) and mouse models (18, 20, 21) in which all miRNAs are lacking. Recently, Kim et al. (21) identified a subgroup of miRNAs, normally enriched in the midbrain, which expression is altered in sporadic Parkinson's disease (PD). One of the affected miRNAs, miR-133b, controls the differentiation and function of dopaminergic neurons (which are lost in PD). Here, we sought to investigate whether changes in miRNA expression exist in sporadic AD, and whether these changes could contribute to Aβ pathology.
Results
miRNA Profile Analysis of Sporadic AD Brain.
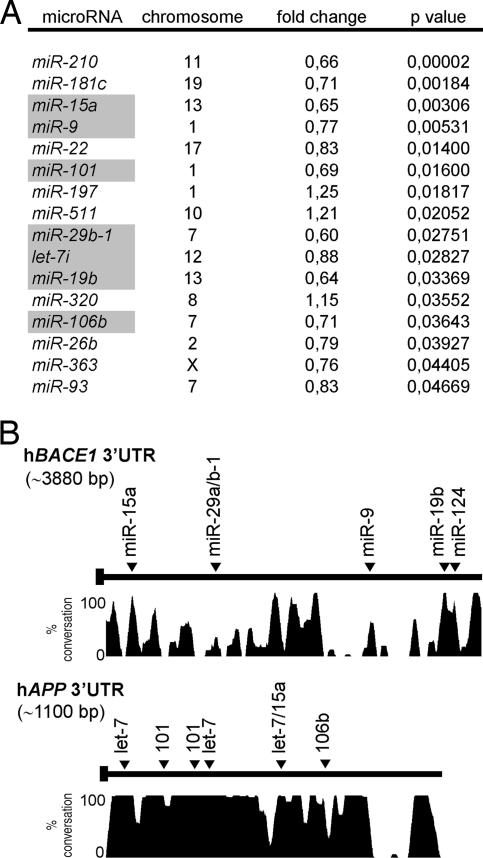
In a pilot study, we assessed the expression profiles of 328 human miRNAs from sporadic AD patients [supporting information (SI), Dataset S1, Dataset S2, and Dataset S3]. We profiled five AD cases and five age-matched controls individually and used these data to identify miRNAs that were significantly (P < 0.05, Student's t test) altered in AD brain (Fig. 1A).
Fig. 1.
Changes in miRNA levels in sporadic AD brain. (A) Significantly changed miRNAs in cortex of sporadic AD cases. Differences (fold change, compared with controls group), P values, and chromosome localization of miRNA genes are shown. miRNAs predicted to _target BACE1 and/or APP 3′UTRs identified by various algorithms: miRanda (www.microrna.org), _targetscan (_targetscan.org), Pictar (pictar.bio.nyu.edu), and miRbase (http://microrna.sanger.ac.uk) are highlighted in gray. (B) Conservation plot of human BACE1 and APP 3′UTRs with putative miRNA binding sites. The percentage of conservation in four mammalian species (human, mouse, rat, and dog) is shown. bp, base pairs.
We used the prediction algorithms miRanda (22), _targetscan (23, 24), Pictar (25), and miRbase (26) to identify AD-related potential _target genes for these miRNAs. Interestingly, at least 7 of the 13 significantly altered miRNAs had candidate binding sites within the 3′ UTRs of BACE1 (miR-15a, -29b-1, -9, and -19b) or APP (let-7, miR-101, miR-15a, and miR-106b) (Fig. 1 A and B), whereas only one candidate miRNA-binding site was found within the 3′ UTR of PSEN1 (miR-9) (data not shown). We did not find miRNA _target sites within the 3′UTRs of PSEN2, Nicastrin, Pen-2, Aph-1a, Aph-1b, Neprilysin, and IDE genes, all implicated in Aβ metabolism. The possibility that alterations in miRNA expression could contribute to changes in APP and BACE1 levels in sporadic AD was further investigated.
High BACE1 Expression in a Subgroup of Sporadic AD Patients.
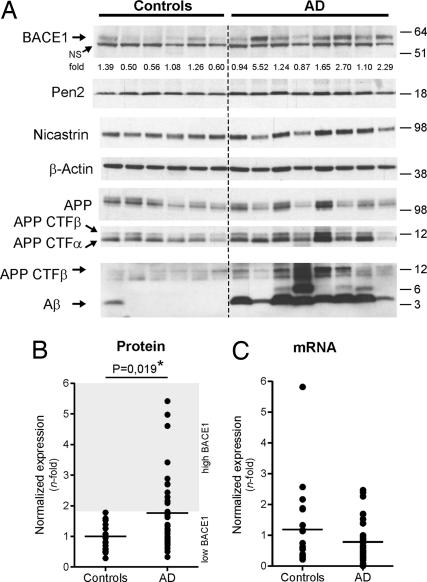
We evaluated BACE1 and APP protein expression in 34 sporadic AD patients and 21 controls. Representative Western blot results are shown in Fig. 2A. The high variability of (full length) APP in control patients precluded definitive conclusions with regard to the possible correlation between miRNA changes and APP expression in AD (Fig. 2A, row 5, and data not shown). However, and consistent with previous reports (5–10), BACE1 was significantly increased in AD patient samples (Fig. 2A, row 1). This difference is contributed by a subgroup of AD patients (11 of 34) that displayed BACE1 levels, which were 2- to 5-fold higher than in controls (P = 0.019, Mann–Whitney test) (Fig. 2B). We used the expression of the γ-secretase components Pen-2 and Nicastrin as further internal controls (Fig. 2A, rows 2–4) to demonstrate that observed changes are specific for BACE1. Deglycosylation experiments finally showed that both immature and mature BACE1 species were up-regulated in AD cases (Fig. S1).
Fig. 2.
BACE1 up-regulation in sporadic AD brain. (A) Representative Western blot of BACE1 (probed with C-terminal antibody), Pen-2 (probed with B96 antibody), Nicastrin (probed with 9C3 antibody), APP full-length (probed with B63 antibody), APP CTFs (probed with B63 and WO2 antibodies), and Aβ (probed with WO2 antibody) in AD and age-matched controls is shown. β-actin was used as normalization control. Densitometric quantifications of BACE1 are shown (fold difference, average of controls = 1). (B) Densitometric quantifications of BACE1 protein levels in sporadic AD (n = 34) vs. controls (n = 21). For each gel, the average of the controls was used as reference (i.e., 1-fold). β-actin was used as normalization control. The graph mean is shown. The “AD high BACE1” subgroup is defined as 2 standard deviations from the controls group. (C) qRT-PCR of BACE1 mRNA from representative controls (n = 20) and from AD patients (n = 34). β-Actin mRNA was used as normalization control. The average of the controls was used as reference (i.e., 1-fold). The graph mean is shown. NS, nonspecific band.
Consistent with previous data (8), BACE1 mRNA levels remained essentially unchanged in the AD samples (Fig. 2C), as shown by quantitative RT-PCR (qRT-PCR). Overall, these results concur with the hypothesis that increased BACE1 expression is due to alterations in posttranscriptional regulation mechanisms in a subgroup of sporadic AD patients. These observations prompted us to analyze in further detail the potential regulation of BACE1 expression by miRNAs.
BACE1 Is a miRNA _target Gene.
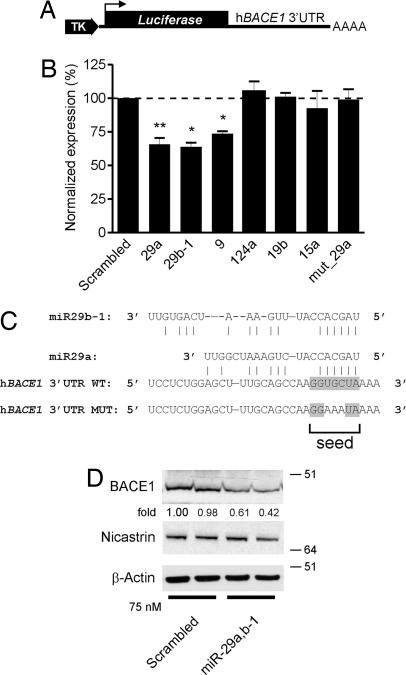
We generated a luciferase reporter construct containing the 3′ UTR of human BACE1 (Fig. 3A). We cotransfected this construct with the miRNAs identified in our microarray analysis (miR-15a, -9, -19b, and -29b-1) and included in addition miR-29a and -124a. These two latter miRNAs also theoretically bind to the 3′UTR of BACE1, as indicated by our in silico analysis (see above; data not shown). Of note, miR-29a, which is coexpressed as a cluster with miR-29b-1 on chromosome 7 in human (27), was found down-regulated by the microarray experiments but failed to reach a significant value (Dataset S2), perhaps because of the cross-reactivity of the miRNA probes (12).
Fig. 3.
BACE1 is a miRNA _target gene. (A) Schematic representation (not to scale) of the BACE1 3′UTR luciferase construct. TK, thymidine kinase promotor. Luc, luciferase gene. (B) BACE1 3′UTR (wt or mutant, see C) luciferase and Renilla luciferase constructs were transfected into HeLa cells with the indicated miRNA oligonucleotides at a final concentration of 75 nM. Normalized (to Renilla) sensor luciferase activity is shown as a percentage of the control with a scrambled oligonucleotide. Error bars represent standard deviations derived from three or more independent experiments performed in duplicate. Statistical significance between control (scrambled miR-treated) and candidate miR-treated HeLa cells was determined by a Wilcoxon test (*, P < 0.05, **, P < 0.01). (C) The sequence and putative binding sites of the miR-29a/b-1 family are shown. The miR-29a/b-1 seed sequence is highlighted in gray. In the hBACE1 3′UTR MUT construct, the binding site for miR-29a/b-1 is mutated as indicated. (D) Western blot analysis of endogenous BACE1 (probed with C-terminal antibody), Nicastrin (used as additional control) and β-actin in SK-N-SH cells treated with 75 nM (final concentration) of miR-29a/b-1. Note that cell extracts were treated with PGNase F (Roche) overnight to remove N-linked sugars before immunoblot analysis explaining the lower molecular weight of BACE1 and Nicastrin. Densitometric quantifications of BACE1 (shown as fold difference) are shown.
We found that miR-29a (P = 0.008, Wilcoxon signed-rank test), miR-29b-1 (P = 0.0313), and miR-9 (P = 0.0313) affected significantly luciferase expression (Fig. 3B), whereas miR-15a, -19b, and -124a showed no effect in this assay. We could confirm that miR-29a and -29b-1 showed coregulated expression with BACE1 in brain development and AD (see below), whereas we did not find such correlation for miR-9. We therefore focused our further work on miR-29a/b-1. These two miRNAs _target conserved binding sites within the BACE1 3′UTR (Fig. 3C). To exclude off-_target effects, we mutated the “top-score” miR-29a/b-1 seed sequence in the BACE1 3′ UTR (Fig. 3C). This mutation abrogated repression of luciferase expression by miR-29a (Fig. 3B, last lane). We confirmed these results in human neuroblastoma SK-N-SH cells, demonstrating that miR-29a/b-1 could suppress endogenous BACE1 expression by ≈50% upon transient transfection (Fig. 3D).
Changes in miR-29a/b-1 Correlate with BACE1 Expression in AD.
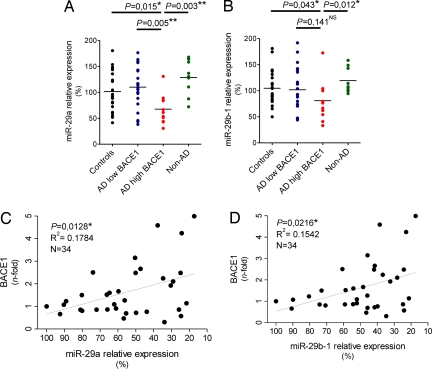
We next evaluated to what extent miR-29a and -29b-1 accumulation was affected in the subgroup of AD patients with high BACE1 (see Fig. 2B) using qRT-PCR (which measures specifically mature miRNAs). We found a significant reduction of miR-29a (P = 0.015, Mann–Whitney test) and miR-29b-1 (P = 0.043) in the subgroup of AD with high BACE1 levels (n = 11) when compared with controls (n = 21) or with patients with normal levels of BACE1 (n = 23, indicated as low BACE1) (Fig. 4 A and B and Fig. S2). It should be noted that we discuss here relative levels of expression of miRNAs. A tendency toward lowered miR-9 levels was also observed in the high BACE1 patients, but these did not reach statistical significance (P = 0.07) (Fig. S3). The expression of miR-29c, which belongs to the miR-29 family but is located on chromosome 1, was not changed between controls and patient subgroups (Fig. S3). We finally verified miR-29a/b-1 levels in an additional group of nine patients with non-AD dementia and found (Fig. 4 A and B, last lane) no significant changes compared to controls. Thus, overall, we find that in the subgroup of AD patients with increased BACE1 expression, miR-29a and -29b-1 expression is significantly and specifically decreased.
Fig. 4.
Misregulation of miR-29a/b-1 in AD brain. (A) miR-29a and (B) -29b-1 levels were quantified by qRT-PCR in controls, AD patients with low BACE1, AD patients with high BACE1, and non-AD dementia patients. Relative expression is shown as percentage using the mean of the controls group as reference (100% = no change in expression). The graph mean is shown. (C and D) Pearson's correlation test demonstrates significant correlation between miR-29a/b-1 and BACE1 in complete set of AD patients. Relative expression is shown as percentage using the lowest ΔCt value (here, highest miR levels) of miR-29a/b-1 as 100%. BACE1 quantifications are identical as in Fig. 2B. In all experiments, ubiquitously expressed miR-16 was used as normalization control for qRT-PCR. Statistical significance was determined by a Mann–Whitney test.
We finally found a statistically significant correlation between BACE1 and miR-29a (P = 0.0128, Pearson's correlation) (Fig. 4C) and miR-29b-1 (P = 0.0216) (Fig. 4D) expression in the complete set of AD cases (low and high BACE1 together, n = 34) providing further support for the hypothesis that changes in miR-29a or -29b-1 contribute, at least in part, to overall changes in BACE1 expression in AD. It should be noted that all of the experiments were performed on cortical material (anterior temporal cortex) from the patients. However, we repeated the analyses using material obtained from cerebellum and found a similar correlation between BACE1 and miR-29a/b-1 (n = 15) (Fig. S4).
Developmental Coregulation of miR-29a/b-1 and BACE1 in Brain.
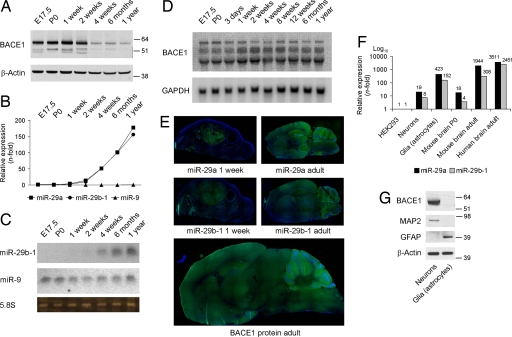
We sought independent confirmation for the correlation between miR-29a/b-1 expression and BACE1 in nonpathological settings. First, we found that miR-29a/b-1 followed BACE1 during brain development (Fig. 5 A–C), suggesting a molecular mechanism for the previously noticed developmental regulation of BACE1 (28). Northern blot analysis showed that the BACE1 mRNA remained remarkably stable over the analyzed time period (Fig. 5D), which is a typical signature of miRNA regulation. Consistent with the qRT-PCR and Northern blot results, we could show by in situ hybridization that miR-29a and -29b-1 are developmentally regulated in the mouse brain with highest expression in adult. Importantly, these miRNAs are coexpressed with BACE1 in all regions of adult brain (Fig. 5E and Fig. S5). We also found that miR-29a/b-1 is expressed in primary cultures of neuronal and glial cells (Fig. 5E), which is consistent with previous observations (29). As seen by others (30), BACE1 is highly expressed in neurons (Fig. 5F), whereas weak levels of BACE1 could be detected in glial cells after prolonged exposure of the film (data not shown). Hence, miR-29a/b-1 and BACE1 are coexpressed in similar cell types in the brain.
Fig. 5.
Developmental coregulation of miR-29a/b-1 and BACE1. (A) Western blot analysis of BACE1 (probed with C-terminal antibody) from prenatal and postnatal mouse brain. β-actin was used as loading control. (B) miR-29a, -29b, and -9 expression levels was measured by qRT-PCR from total RNA. Ribosomal nuclear RNA 19 (RNU19) was used as normalization control. Relative expression of miRNAs was calculated by using the relative quantification method (using embryonic day 17.5 as 1-fold). (C) Northern blot analysis for miR-29b-1 and -9 from total RNA. Ribosomal 5.8S was used as loading control. (D) Northern blot analysis of murine BACE1 mRNA levels. Note that the BACE1 probe recognized different mRNA transcripts, as observed (32). GAPDH was used as loading control. (E) Top and Middle: in situ hybridization signals for miR-29a or -29b-1 in total brains of 1-week- or 2-month-old wild-type mice. The green strainings represent miR-29. The blue strainings represent DAPI (nuclei). (Bottom) Immufluorescence signals (in green) for BACE1 protein (probed with C-terminal antibody) in 2-month-old mouse brain. (F) miR-29a and -29b-1 levels were measured by qRT-PCR from total RNA from primary cultured neurons, glia, mouse total brain (postnatal day 0 and 6 months) and adult human brain (cortex, n = 5, average of 54 years old). RNU19 was used as normalization control. Relative expression of miRNAs was calculated by using the relative quantification method (using HEK293 as 1-fold). (G) Western blot analysis of BACE1, MAP2 (neuronal maker), and GFAP (astrocytic marker) of primary cultured neurons and glia (same samples used in E). β-Actin was used as loading control.
miR-29a/b-1 Modulates BACE1 Activity and Aβ.
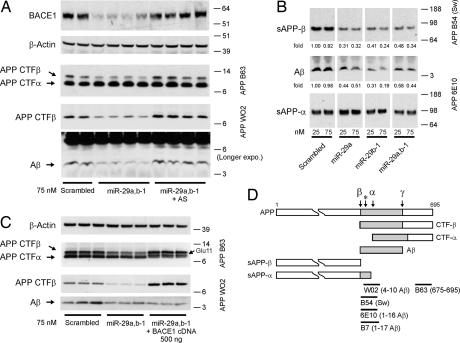
We finally wanted to determine a causal relationship between miR-29a/b-1 expression and BACE1 activity (and hence Aβ generation). Attempts to modulate miR-29a/b-1 levels in primary neurons turned out to be very inefficient, making definite conclusions from these assays impossible. We therefore performed gain- and loss-of-function experiments using HEK293 cells (that express weak levels of endogenous miR-29a/b-1; see Fig. 5F) stably expressing human APP Swedish form to _target endogenous BACE1. In these cells, both miR-29a and -29b-1 can down-regulate endogenous BACE1 upon transient overexpression (Fig. 6A). As a control, we used a scrambled miRNA oligonucleotide sequence. The levels of APP β-CTFs and Aβ peptide (the two major proteolytic fragments of BACE1 activity, Fig. 6D) are down-regulated upon miR-29a/b-1 expression (Fig. 6A). These functional effects could be reversed with complementary anti-miR-29a/b-1 oligonucleotides. Thus, loss of the suppressing activity of the miR-29a/b-1 cluster can lead to an increase in Aβ production in cell culture. In an independent set of experiments, we show that soluble “shed” APP-β and soluble Aβ is specifically reduced (≈50−80%) upon miR-29a and/or miR-29b-1 treatment (Fig. 6B). Here, soluble APP-α generated by α-secretase activity was used as internal control. By transient overexpression of BACE1, we could restore β-secretase activity in miR-29a/b-1-treated cells as observed by an increase in APP β-CTFs (Fig. 6C). No change in Aβ levels is consistent with the increase in Glu-11 APP β-CTFs (and loss of the WO2 antibody epitope) in the presence of exogenously active BACE1 (31, 32).
Fig. 6.
Modulation of BACE1 activity by miR-29a/b-1. (A) Western blot analysis of endogenous human BACE1 (probed with 3D5 antibody) and APP-CTFs (α and β) in premiR (miR-29a/b-1) or anti-miR (miR-29a/b-1 antisense)-treated HEK293-APP-Sw cells (75 nM final concentration). APP-CTFα and β-Actin were used as loading controls. (B) Western blot analysis of secreted APP (α and β) and Aβ in premiR (miR-29a and/or miR-29b-1) treated HEK293-APP-Sw cells. Two concentrations (25 or 75 nM) are shown. Densitometric quantifications of soluble Aβ and sAPPβ are shown. The levels of sAPPα were used as normalization control. AS, antisense. (C) Western blot analysis of APP-CTFs (α and β) in premiR-29a/b-1-treated HEK293-APP-Sw cells (75 nM final concentration) alone or in combination with human BACE1 cDNA. APP-CTFα and β-actin were used as loading controls. Note that Aβ peptides were immunoprecipitated with B7 antibody before Western blot analysis with WO2. (D) Schematic representation (not to scale) of human APP 695 isoform and its cleavage sites by α-, β-, and γ-secretases. The β-secretase Glu-11 cleavage site is indicated with a “*” sign. Epitopes from the antibodies used in this study are indicated.
Discussion
We conclude that an important subgroup (≈30%) of sporadic AD patients displays increased BACE1 protein expression in the brain (this study and refs. 5–10), further establishing BACE1 as an important drug _target for the treatment of AD. Based on (i) theoretical predictions, (ii) in vitro validation in cells, (iii) the tight correlation in expression during brain development and in isolated primary cells, and (iv) careful analysis of a series of well preserved frozen brain tissue of a sporadic AD population, we identify the miR-29a/b-1 cluster as a potential major suppressor of BACE1 protein expression.
It is clear that, apart from changes in miRNA expression, other mechanisms can contribute to BACE1 expression in AD (33). BACE1 might also be regulated at the transcriptional level under inflammatory conditions via the PPARγ responsive elements (34). However, in the patient samples we investigated here, BACE1 mRNA was not significantly changed, whereas regression analysis indicated that changes in miR-29a/b-1 contributed to overall BACE1 expression in this sporadic AD population (34 patients).
The presence of miR-29a/b-1 in neuronal and glial cells (this article and ref. 29) suggests that derepression of BACE1 expression can occur in neurons or astrocytes alike. BACE1/β-secretase can become expressed in both cell types (32, 35–37), and increased BACE1 expression can be observed in neurons and glia in AD patients and in AD mouse models (35, 37–39). Although neurons and glia can theoretically contribute to Aβ load in the brain, further work is now needed to address the cell-type specificity of the observed effects of miR-29a/b-1 on BACE1 expression in vivo.
The loss of miR-29a/b-1 and increased BACE1 expression is not specific for a certain brain area, as demonstrated by our separate analysis of material taken from the cerebellum (a brain area not affected by AD) and as suggested by the relative broad expression pattern of BACE1 and miR-29a/b-1 in the brain. This does not necessarily weaken our hypothesis, because its only implication is that the alterations in BACE1 expression do not provide an explanation for the increased sensitivity of particular brain regions for the disease process. It should be noted that the same holds true for the other known causes of (genetic) AD: whereas mutations or gene duplications of, for instance, APP are present in all cells of the brain, also in those cases only specific regions of the brain suffer from AD.
A role for miRNAs in lifespan control and in aging in adult worms has been documented (40). We speculate that during life in humans, the gene-regulatory networks regulated by miRNAs could become progressively compromised in some individuals. This could influence brain function in many ways, but if by chance the miR-29a/b-1 cluster is affected, this could lead to decreased suppression of BACE1 expression and increased Aβ generation. Interestingly, Fabbri et al. (41) have recently shown that the miR-29 family, via DNA methyltransferase 3A and 3B transcriptional regulation, can regulate DNA methylation (41). Abnormal DNA methylation can cause cell death and is documented to be altered in AD (42). In addition, work by Niwa et al. (43) supports a role for the let-7 miRNA family in modulating Apl-1 expression in Caenorhabditis elegans, providing in vivo evidence for the modulation of APP by miRNAs (43). Thus, the combination of increased Aβ generation and of the gradual loss of the fine genetic regulation by the miRNA networks in the aging neurons could provide a scenario for the observed neurodegeneration in sporadic AD. Loss of specific miRNAs sets thus the stage for considering a “multiple hit hypothesis” for sporadic AD.
This study also suggests that miRNA expression profiles are altered in sporadic AD. Whether these changes are specific for sporadic AD, or whether they are a cause or a consequence of the disease process, remains to be investigated. In addition, whether these data can be used for diagnostic purposes, as seen in cancer patients (for example, see ref. 44), remains an interesting possibility. Of note, a study by Lukiw (45) showed that miR-9 and -128 were significantly up-regulated in AD hippocampus. Although our microarray data identified miR-9 to be down-regulated in AD cortex, these results are consistent with the idea that some miRNAs can be differently expressed in AD brain.
In conclusion, the current findings suggest a loss-of-function mechanism contributing to sporadic AD. Our work also provides an interesting molecular link between sporadic AD and the amyloid cascade.
Materials and Methods
Patients and Cell Lines.
Details regarding patient information can be found in SI Methods. HeLa, SK-N-SH, HEK293, and HEK293 cells stably expressing APP-Swedish form were cultured in DMEM/F12 medium, as described (46). Primary cultures of cortical neurons and glial cells were prepared from wild-type mice as described (32).
miRNA Microarray.
Details, including fold changes and statistical calculations, are found in Dataset S1, Dataset S2, Dataset S3, and SI Methods.
Antibodies.
APP B63 (previously known as B10) (46), APP B/7 (32), APP WO2 (The Genetics Company), APP B54.4 (recognizes specifically the APP-β cleavage Swedish mutant epitope; a generous gift from B. Greenberg Cephelon), APP 6E10 (Signet Laboratories), β-Actin (Sigma–Aldrich), BACE1 C terminus (Prosci), BACE1 3D5 (9) (a generous gift from R. Vassar, Northwestern University, Evenston, IL), Nicastrin 9C3 (47), Pen-2 B96 (46), and MAP2 (H-300, Santa Cruz Biotechnology) were used.
Protein Extraction and Western Blot Analysis.
Cells were rinsed in PBS and lysed in buffer: 1% Triton X-100; 50 mM Hepes, pH 7.6; 150 mM NaCl; 1 mM EDTA; and complete protease inhibitors (Roche). To detect proteins from the media, DMEM/F12 medium was collected and spun at 1,000 ×g for 5 min. Then, the supernatant was mixed with reducing loading buffer and heated at 70°C for 10 min. Proteins from human brain tissue, mouse brain (two to six brains from wild-type mice were pooled per time point), mouse brain regions [one to two brains from 6-month-old wild-type or BACE1 KO mice (32)], primary cortical neurons (days in vitro 11), and primary glia (days in vitro 14) were extracted by using the miRVana PARIS kit (Ambion). Immunoblot analysis was performed as described (48).
qRT-PCR (mRNA and miRNA).
Details are found in SI Methods.
Northern Blot Analysis (mRNA and miRNA).
Technical details are found in SI Methods.
In Situ Hybridization.
FITC-labeled LNA mmu-miR29a and mmu-miR-29b-1 probes were purchased from Exiqon. A scrambled oligonucleotide was used as control (date not shown). Wild-type young (postnatal day 7) or adult (54–60 days old) were processed as described (49). BACE1 immunofluorescence was performed by using the BACE1 C-terminal antibody. Details are available on demand.
Transfections, DNA Cloning, and Luciferase Assays.
Details are found in SI Methods.
Statistical Methodologies.
BACE1 densitometric quantifications were performed by using ImageQuant software (Amersham Biosciences). Statistical significance was determined by using the two-tailed Mann–Whitney U, Wilcoxon signed rank, or nonparametric Pearson's correlation test. Calculations were performed by using GraphPad Prism software.
Supplementary Material
Acknowledgments.
This work was supported by a Pioneer Award from the Alzheimer's Association, the Fund for Scientific Research; Flanders, K.U. Leuven [GOA (Geconcerteerde Onderzoeksactie) and Methusalem Grant]; Federal Office for Scientific Affairs (Grant IUAP P6/43), Belgium; Association International pour la Recherche sur la Maladie d/Alzheimer (AIRMA) funding (to the AD Brain Bank); and a grant from the Lundbeck Foundation (to A.N.S. and S.K.). S.S.H. is a Marie Curie postdoctoral researcher.
Note.
During the reviewing process, a paper was published confirming the principle that BACE1 expression in AD is affected by changes in miRNAs (50).
Footnotes
The authors declare no conflict of interest.
This article is a PNAS Direct Submission.
This article contains supporting information online at www.pnas.org/cgi/content/full/0710263105/DCSupplemental.
References
- 1.Rovelet-Lecrux A, et al. APP locus duplication causes autosomal dominant early-onset Alzheimer disease with cerebral amyloid angiopathy. Nat Genet. 2006;38:24–26. doi: 10.1038/ng1718. [DOI] [PubMed] [Google Scholar]
- 2.Sherrington R, et al. Cloning of a gene bearing missense mutations in early-onset familial Alzheimer's disease. Nature. 1995;375:754–760. doi: 10.1038/375754a0. [DOI] [PubMed] [Google Scholar]
- 3.Rogaev EI, et al. Familial Alzheimer's disease in kindreds with missense mutations in a gene on chromosome 1 related to the Alzheimer's disease type 3 gene. Nature. 1995;376:775–778. doi: 10.1038/376775a0. [DOI] [PubMed] [Google Scholar]
- 4.Annaert W, De Strooper B. A cell biological perspective on Alzheimer's disease. Annu Rev Cell Dev Biol. 2002;18:25–51. doi: 10.1146/annurev.cellbio.18.020402.142302. [DOI] [PubMed] [Google Scholar]
- 5.Yang LB, et al. Elevated beta-secretase expression and enzymatic activity detected in sporadic Alzheimer disease. Nat Med. 2003;9:3–4. doi: 10.1038/nm0103-3. [DOI] [PubMed] [Google Scholar]
- 6.Fukumoto H, Cheung BS, Hyman BT, Irizarry MC. Beta-secretase protein and activity are increased in the neocortex in Alzheimer disease. Arch Neurol. 2002;59:1381–1389. doi: 10.1001/archneur.59.9.1381. [DOI] [PubMed] [Google Scholar]
- 7.Sun A, Koelsch G, Tang J, Bing G. Localization of beta-secretase memapsin 2 in the brain of Alzheimer's patients and normal aged controls. Exp Neurol. 2002;175:10–22. doi: 10.1006/exnr.2002.7875. [DOI] [PubMed] [Google Scholar]
- 8.Holsinger RM, et al. Increased expression of the amyloid precursor beta-secretase in Alzheimer's disease. Ann Neurol. 2002;51:783–786. doi: 10.1002/ana.10208. [DOI] [PubMed] [Google Scholar]
- 9.Zhao J, et al. Beta-site amyloid precursor protein cleaving enzyme 1 levels become elevated in neurons around amyloid plaques: implications for Alzheimer's disease pathogenesis. J Neurosci. 2007;27:3639–3649. doi: 10.1523/JNEUROSCI.4396-06.2007. [DOI] [PMC free article] [PubMed] [Google Scholar]
- 10.Tesco G, et al. Depletion of GGA3 Stabilizes BACE and Enhances beta-Secretase Activity. Neuron. 2007;54:721–737. doi: 10.1016/j.neuron.2007.05.012. [DOI] [PMC free article] [PubMed] [Google Scholar]
- 11.Li R, et al. Amyloid beta peptide load is correlated with increased beta-secretase activity in sporadic Alzheimer's disease patients. Proc Natl Acad Sci USA. 2004;101:3632–3637. doi: 10.1073/pnas.0205689101. [DOI] [PMC free article] [PubMed] [Google Scholar]
- 12.Miska EA, et al. Microarray analysis of microRNA expression in the developing mammalian brain. Genome Biol. 2004;5:R68. doi: 10.1186/gb-2004-5-9-r68. [DOI] [PMC free article] [PubMed] [Google Scholar]
- 13.Sempere LF, et al. Expression profiling of mammalian microRNAs uncovers a subset of brain-expressed microRNAs with possible roles in murine and human neuronal differentiation. Genome Biol. 2004;5:R13. doi: 10.1186/gb-2004-5-3-r13. [DOI] [PMC free article] [PubMed] [Google Scholar]
- 14.Barad O, et al. MicroRNA expression detected by oligonucleotide microarrays: system establishment and expression profiling in human tissues. Genome Res. 2004;14:2486–2494. doi: 10.1101/gr.2845604. [DOI] [PMC free article] [PubMed] [Google Scholar]
- 15.Hohjoh H, Fukushima T. Expression profile analysis of microRNA (miRNA) in mouse central nervous system using a new miRNA detection system that examines hybridization signals at every step of washing. Gene. 2007;391:39–44. doi: 10.1016/j.gene.2006.11.018. [DOI] [PubMed] [Google Scholar]
- 16.Mehler MF, Mattick JS. Non-coding RNAs in the nervous system. J Physiol. 2006;575:333–341. doi: 10.1113/jphysiol.2006.113191. [DOI] [PMC free article] [PubMed] [Google Scholar]
- 17.Schratt GM, et al. A brain-specific microRNA regulates dendritic spine development. Nature. 2006;439:283–289. doi: 10.1038/nature04367. [DOI] [PubMed] [Google Scholar]
- 18.Hebert SS, De Strooper B. Molecular biology. miRNAs in neurodegeneration. Science. 2007;317:1179–1180. doi: 10.1126/science.1148530. [DOI] [PubMed] [Google Scholar]
- 19.Bilen J, et al. MicroRNA pathways modulate polyglutamine-induced neurodegeneration. Mol Cell. 2006;24:157–163. doi: 10.1016/j.molcel.2006.07.030. [DOI] [PubMed] [Google Scholar]
- 20.Schaefer A, et al. Cerebellar neurodegeneration in the absence of microRNAs. J Exp Med. 2007;204:1553–1558. doi: 10.1084/jem.20070823. [DOI] [PMC free article] [PubMed] [Google Scholar]
- 21.Kim J, et al. A MicroRNA feedback circuit in midbrain dopamine neurons. Science. 2007;317:1220–1224. doi: 10.1126/science.1140481. [DOI] [PMC free article] [PubMed] [Google Scholar]
- 22.Abel S, et al. The transmembrane CXC-chemokine ligand 16 is induced by IFN-gamma and TNF-alpha and shed by the activity of the disintegrin-like metalloproteinase ADAM10. J Immunol. 2004;172:6362–6372. doi: 10.4049/jimmunol.172.10.6362. [DOI] [PubMed] [Google Scholar]
- 23.Chang J, et al. miR-122, a mammalian liver-specific microRNA, is processed from hcr mRNA and may down-regulate the high affinity cationic amino acid transporter CAT-1. RNA Biol. 2004;1:106–113. doi: 10.4161/rna.1.2.1066. [DOI] [PubMed] [Google Scholar]
- 24.Best JD, et al. Quantitative measurement of changes in amyloid-beta(40) in the rat brain and cerebrospinal fluid following treatment with the gamma-secretase inhibitor LY-411575 [N2-[(2S)-2-(3,5-difluorophenyl)-2-hydroxyethanoyl]-N1-[(7S)-5-methyl-6-ox o-6,7-dihydro-5H-dibenzo[b, d]azepin-7-yl]-l-alaninamide] J Pharmacol Exp Ther. 2005;313:902–908. doi: 10.1124/jpet.104.081174. [DOI] [PubMed] [Google Scholar]
- 25.Grun D, et al. microRNA _target predictions across seven Drosophila species and comparison to mammalian _targets. PLoS Comput Biol. 2005;1:e13. doi: 10.1371/journal.pcbi.0010013. [DOI] [PMC free article] [PubMed] [Google Scholar]
- 26.Griffiths-Jones S. The microRNA Registry. Nucleic Acids Res. 2004;32:D109–D111. doi: 10.1093/nar/gkh023. [DOI] [PMC free article] [PubMed] [Google Scholar]
- 27.Hwang HW, Wentzel EA, Mendell JT. A hexanucleotide element directs microRNA nuclear import. Science. 2007;315:97–100. doi: 10.1126/science.1136235. [DOI] [PubMed] [Google Scholar]
- 28.Willem M, et al. Control of peripheral nerve myelination by the beta-secretase BACE1. Science. 2006;314:664–666. doi: 10.1126/science.1132341. [DOI] [PubMed] [Google Scholar]
- 29.Smirnova L, et al. Regulation of miRNA expression during neural cell specification. Eur J Neurosci. 2005;21:1469–1477. doi: 10.1111/j.1460-9568.2005.03978.x. [DOI] [PubMed] [Google Scholar]
- 30.Laird FM, et al. BACE1, a major determinant of selective vulnerability of the brain to amyloid-beta amyloidogenesis, is essential for cognitive, emotional, and synaptic functions. J Neurosci. 2005;25:11693–11709. doi: 10.1523/JNEUROSCI.2766-05.2005. [DOI] [PMC free article] [PubMed] [Google Scholar]
- 31.Creemers JW, et al. Processing of beta-secretase by furin and other members of the proprotein convertase family. J Biol Chem. 2001;276:4211–4217. doi: 10.1074/jbc.M006947200. [DOI] [PubMed] [Google Scholar]
- 32.Dominguez D, et al. Phenotypic and biochemical analyses of BACE1- and BACE2-deficient mice. J Biol Chem. 2005;280:30797–30806. doi: 10.1074/jbc.M505249200. [DOI] [PubMed] [Google Scholar]
- 33.Rossner S, Sastre M, Bourne K, Lichtenthaler SF. Transcriptional and translational regulation of BACE1 expression−implications for Alzheimer's disease. Prog Neurobiol. 2006;79:95–111. doi: 10.1016/j.pneurobio.2006.06.001. [DOI] [PubMed] [Google Scholar]
- 34.Sastre M, et al. Nonsteroidal anti-inflammatory drugs repress beta-secretase gene promoter activity by the activation of PPARgamma. Proc Natl Acad Sci USA. 2006;103:443–448. doi: 10.1073/pnas.0503839103. [DOI] [PMC free article] [PubMed] [Google Scholar]
- 35.Hartlage-Rubsamen M, et al. Astrocytic expression of the Alzheimer's disease beta-secretase (BACE1) is stimulus-dependent. Glia. 2003;41:169–179. doi: 10.1002/glia.10178. [DOI] [PubMed] [Google Scholar]
- 36.Zacchetti D, et al. BACE1 Expression and Activity: Relevance in Alzheimer's Disease. Neurodegener Dis. 2007;4:117–126. doi: 10.1159/000101836. [DOI] [PubMed] [Google Scholar]
- 37.Yamamoto M, et al. Interferon-gamma and tumor necrosis factor-alpha regulate amyloid-beta plaque deposition and beta-secretase expression in Swedish mutant APP transgenic mice. Am J Pathol. 2007;170:680–692. doi: 10.2353/ajpath.2007.060378. [DOI] [PMC free article] [PubMed] [Google Scholar]
- 38.Leuba G, et al. Neuronal and nonneuronal quantitative BACE immunocytochemical expression in the entorhinohippocampal and frontal regions in Alzheimer's disease. Dement Geriatr Cogn Disord. 2005;19:171–183. doi: 10.1159/000083496. [DOI] [PubMed] [Google Scholar]
- 39.Rossner S, et al. Neuronal and glial beta-secretase (BACE) protein expression in transgenic Tg2576 mice with amyloid plaque pathology. J Neurosci Res. 2001;64:437–446. doi: 10.1002/jnr.1095. [DOI] [PubMed] [Google Scholar]
- 40.Boehm M, Slack F. A developmental timing microRNA and its _target regulate life span in C. elegans. Science. 2005;310:1954–1957. doi: 10.1126/science.1115596. [DOI] [PubMed] [Google Scholar]
- 41.Fabbri M, et al. MicroRNA-29 family reverts aberrant methylation in lung cancer by _targeting DNA methyltransferases 3A and 3B. Proc Natl Acad Sci USA. 2007;104:15805–15810. doi: 10.1073/pnas.0707628104. [DOI] [PMC free article] [PubMed] [Google Scholar]
- 42.Mattson MP. Methylation and acetylation in nervous system development and neurodegenerative disorders. Ageing Res Rev. 2003;2:329–342. doi: 10.1016/s1568-1637(03)00013-8. [DOI] [PubMed] [Google Scholar]
- 43.Niwa R, Zhou F, Li C, Slack FJ. The expression of the Alzheimer's amyloid precursor protein-like gene is regulated by developmental timing microRNAs and their _targets in Caenorhabditis elegans. Dev Biol. 2008;315:418–442. doi: 10.1016/j.ydbio.2007.12.044. [DOI] [PMC free article] [PubMed] [Google Scholar]
- 44.Lu J, et al. MicroRNA expression profiles classify human cancers. Nature. 2005;435:834–838. doi: 10.1038/nature03702. [DOI] [PubMed] [Google Scholar]
- 45.Lukiw WJ. Micro-RNA speciation in fetal, adult and Alzheimer's disease hippocampus. Neuroreport. 2007;18:297–300. doi: 10.1097/WNR.0b013e3280148e8b. [DOI] [PubMed] [Google Scholar]
- 46.Hebert SS, et al. Regulated intramembrane proteolysis of amyloid precursor protein and regulation of expression of putative _target genes. EMBO Rep. 2006;7:739–745. doi: 10.1038/sj.embor.7400704. [DOI] [PMC free article] [PubMed] [Google Scholar]
- 47.Esselens C, et al. Presenilin 1 mediates the turnover of telencephalin in hippocampal neurons via an autophagic degradative pathway. J Cell Biol. 2004;166:1041–1054. doi: 10.1083/jcb.200406060. [DOI] [PMC free article] [PubMed] [Google Scholar]
- 48.Hebert SS, et al. Coordinated and widespread expression of gamma-secretase in vivo: evidence for size and molecular heterogeneity. Neurobiol Dis. 2004;17:260–272. doi: 10.1016/j.nbd.2004.08.002. [DOI] [PubMed] [Google Scholar]
- 49.Silahtaroglu AN, et al. Detection of microRNAs in frozen tissue sections by fluorescence in situ hybridization using locked nucleic acid probes and tyramide signal amplification. Nat Protoc. 2007;2:2520–2528. doi: 10.1038/nprot.2007.313. [DOI] [PubMed] [Google Scholar]
- 50.Wang WX, et al. The expression of microRNA miR-107 decreases early in Alzheimer's disease and may accelerate disease progression through regulation of beta-site amyloid precursor protein-cleaving enzyme 1. J Neurosci. 2008;28:1213–1223. doi: 10.1523/JNEUROSCI.5065-07.2008. [DOI] [PMC free article] [PubMed] [Google Scholar]
Associated Data
This section collects any data citations, data availability statements, or supplementary materials included in this article.


