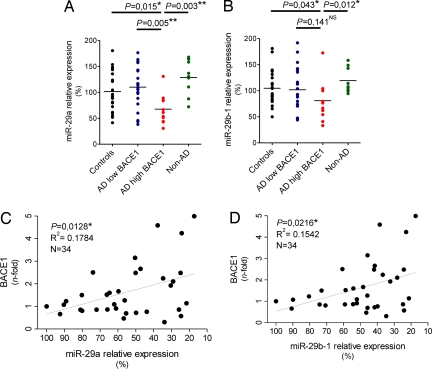
Fig. 4.
Misregulation of miR-29a/b-1 in AD brain. (A) miR-29a and (B) -29b-1 levels were quantified by qRT-PCR in controls, AD patients with low BACE1, AD patients with high BACE1, and non-AD dementia patients. Relative expression is shown as percentage using the mean of the controls group as reference (100% = no change in expression). The graph mean is shown. (C and D) Pearson's correlation test demonstrates significant correlation between miR-29a/b-1 and BACE1 in complete set of AD patients. Relative expression is shown as percentage using the lowest ΔCt value (here, highest miR levels) of miR-29a/b-1 as 100%. BACE1 quantifications are identical as in Fig. 2B. In all experiments, ubiquitously expressed miR-16 was used as normalization control for qRT-PCR. Statistical significance was determined by a Mann–Whitney test.

