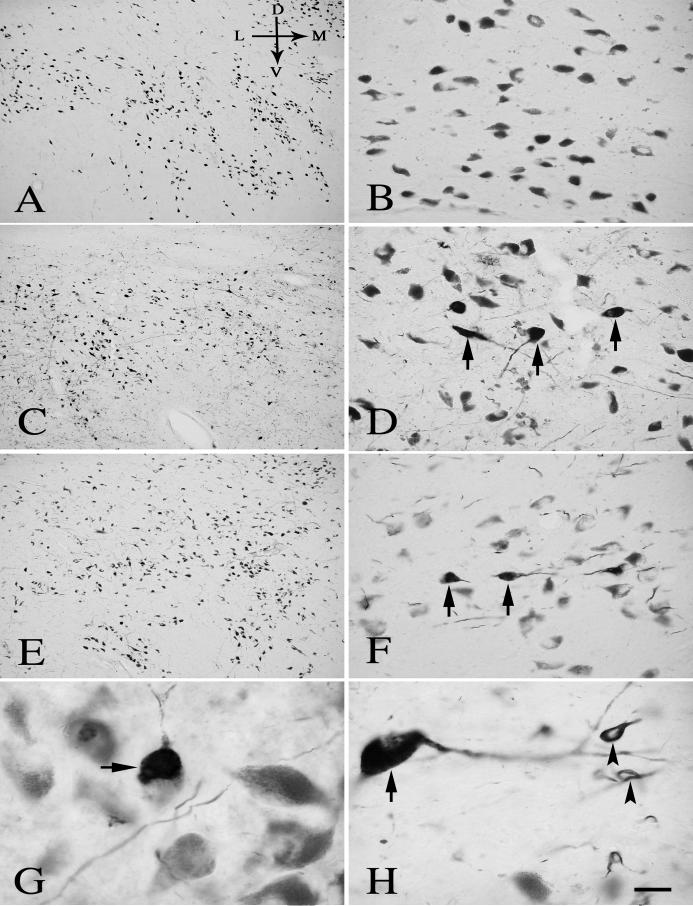
Fig. 8.
Low- (A, C, E) and high-power (B, D, F, G, H) photomicrographs of sections of SN from age-matched control (A, B), PSP (C, D, G), and AD (E, F, H) cases, illustrating the PHF-1 immunoreactivity. There was no PHF-1-ir NFT within NM neurons in the age-matched control case (A, B). PHF-1-ir NFTs were seen within NM neurons (arrows; D, G) in AD. PHF-1-ir NFTs were not only observed in NM neurons (arrows; F, H) but also in glial cells (arrowheads; H) in PSP cases. Scale bar in H = 300μm (applies to A, C, E), 60μm in B, D, F, and 20μm in G, H. Arrows in A indicate dorsal (D), ventral (V), median (M), and lateral (L) orientation.

