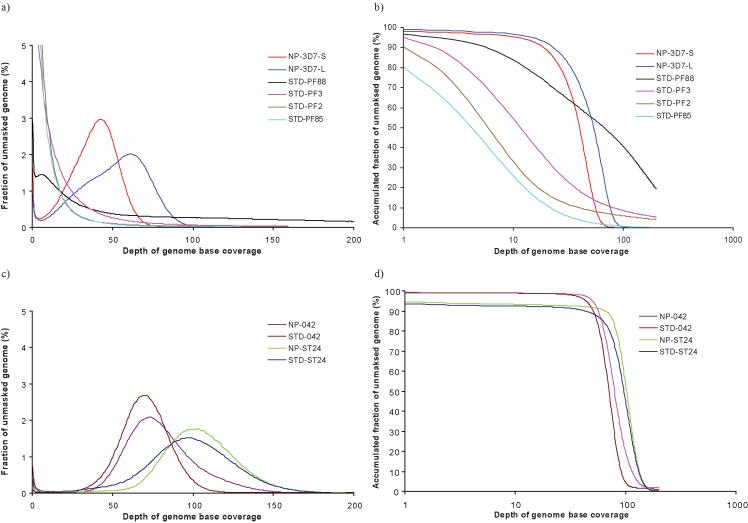
Figure 2. Distribution of genome sequence coverage.
The distribution of sequence coverage across the unmasked genomes are shown for various datasets with (STD) or without (NP) the PCR step. (a) % of unmasked genome against depth of genome base coverage and (b) accumulated % of unmasked genome against depth of genome base coverage for malaria strains (P. falciparum (PF) 2,3,88 and 85 and 3D7) with either long (L) or short (S) reads. (c) % of unmasked genome against depth of genome base coverage and (d) accumulated % of unmasked genome against depth of genome base coverage for E. coli 042 and B. pertussis ST24

