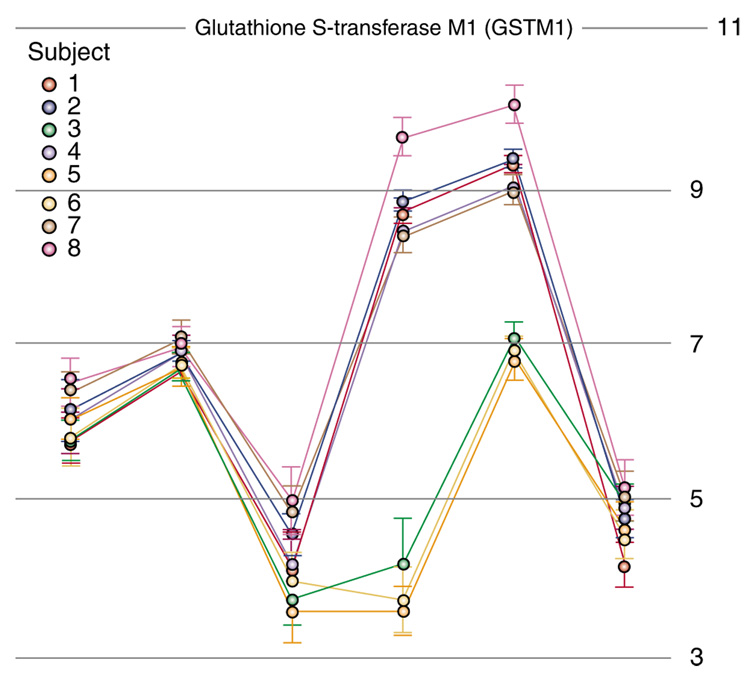
Figure 4.
Splicing variations in glutathione S-transferase M1 (GSTM1) between eight individuals identified by exon array. The X axis points represent six exons within this gene. The Y axis represents the relative abundance of their expression. Note that the 3′ (left) and 5′ (right) ends of the gene show similar expression levels among people, but the fourth and fifth exons of the GSTM1 gene vary in the expression of this transcript.

