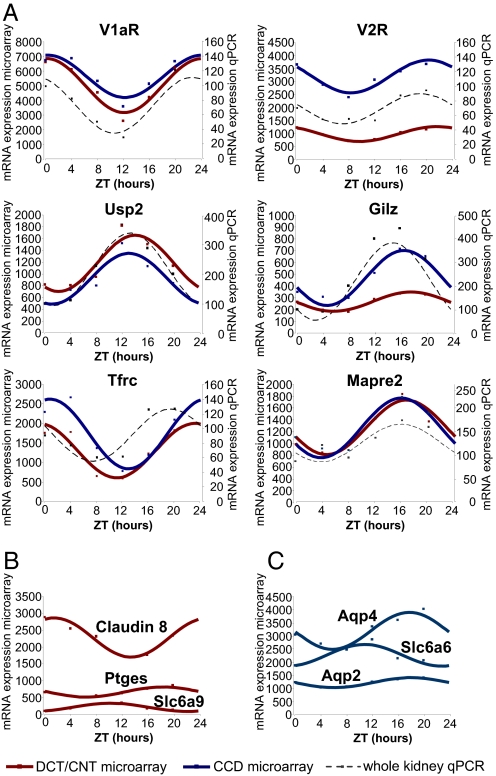
Fig. 3.
Temporal expression profiles of circadian transcripts. (A) Transcripts that meet the circadian criteria in both DCT/CNT and CCD. The red and blue squares show the expression values (arbitrary units of microarray hybridization data) of DCT/CNT and CCD circadian transcripts, respectively. The red and blue solid lines show fitting of the microarray data to the cosine function. The black squares show the qPCR expression values (ZT0 = 100%) of these transcripts in the whole kidney RNA samples. The black dashed line shows fitting of qPCR data to the cosinor function. The qPCR was performed on pools of RNA composed of equivalent amounts of RNA prepared from five animals at each ZT time point. The qPCR data are expressed as arbitrary units normalized for β-actin expression. (B) Transcripts that meet the circadian criteria only in DCT/CNT. (C) Transcripts that meet the circadian criteria only in CCD. Abbreviations used are: V1aR, vasopressin receptor Type 1a; V2R, vasopressin receptor Type 2; Usp2, ubiquitin specific protease 2; Gilz (Tsc22d3), glucocorticoid-induced leucine zipper; Tfrc, transferrin receptor; Mapre2, microtubule-associated protein; Ptges, prostaglandin E synthase; Slc6a9, glycine transporter; Slc6a6, taurine transporter; aqp2, aquaporin 2; aqp4, aquaporin 4.

