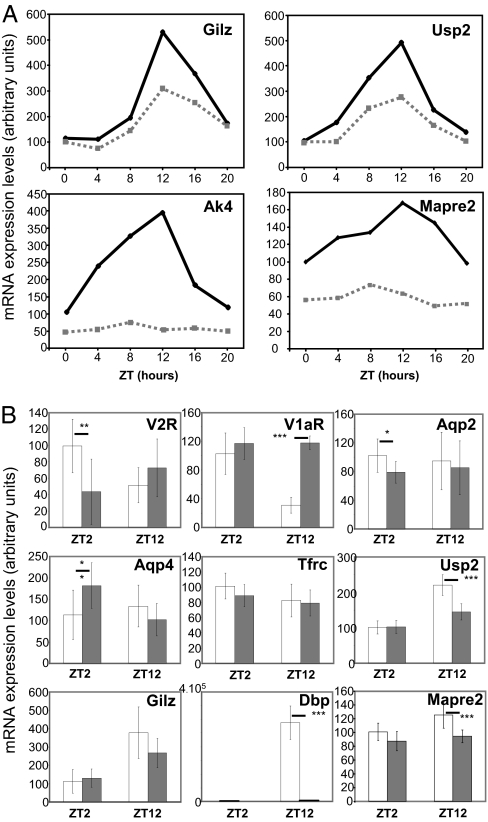
Fig. 4.
(A) Temporal expression pattern of Gilz, Usp2, adenylyl kinase 4 (Ak4), and Mapre2 RNA in whole kidneys of wild-type (solid line) or dbp/hlf/tef triple knockouts (dashed line). Data are expressed as the arbitrary units of qPCR amplification normalized for β-actin expression. The qPCR was performed on pools of RNA composed of equivalent amounts of RNA prepared from six animals at each ZT time point. (B) Expression V2R, V1aR, Aqp-2, Aqp-4, Tfrc, Usp2, Gilz, Dbp, and Mapre2 transcripts at ZT2 and ZT12 in whole kidneys of wild-type (white bars) or clock(−/−) triple knockouts (gray bars). Data are means ± SEM of qPCR amplification values that were obtained from seven mice. Statistical significance was calculated using unpaired t-test. *, P = 0.05; **P < 0.05; ***, P < 0.001.

