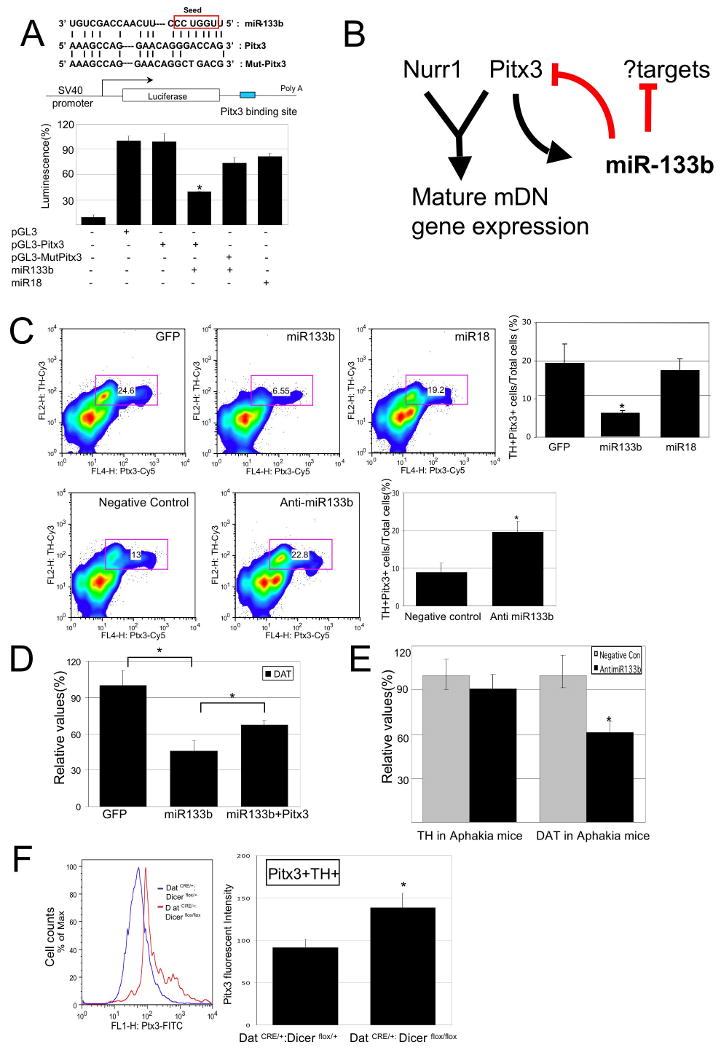
Figure 4.

Pitx3 is a _target of miR-133b activity.
(A) Upper Panel: Schematic of a luciferase assay vector, pGL3-Pitx3 and pGL3-Mut-Pitx3 that harbors 300bp Pitx3 3′-UTR sequences predicted to be subject to miR-133b regulation.
Lower panel: Overexpression of miR-133b (but not miR-18) in 293 cells decreases luciferase expression from pGL3-Pitx3 (but not control vector and pGL3-mut Pitx3). Data represent means ± S.E.M. n=3 independent experiments; Student's t test, *p < 0.05.
(B) miR-133b and Pitx3 define a negative feedback loop in midbrain DN function and differentiation. It is likely that miR-133b has additional significant _targets.
(C) Upper panels: FACS analysis of primary midbrain cultures transduced with miR-133b or control vectors using antibodies for Pitx3 and TH reveals that miR-133b overexpression decrease in both Pitx3 and TH protein expression. Pitx3 is reduced in TH-positive cells transduced with miR-133b relative to control vector or miR-18. Data represent means ± S.E.M. n=3 independent experiments; ANOVA test, *p < 0.05.
Lower panels: Knockdown of miR-133b using modified oligonucleotides leads to a significant induction in Pitx3 and TH protein levels relative to control oligonucleotides. Data represent means ± S.E.M. n=3 independent experiments; Student's t test, *p < 0.05.
(E) miR-133b inhibition by modified oligonucleotides in Pitx3-deficient Aphakia primary neuron cultures fails to induce TH or DAT transcription. Data represent means ± S.E.M. n=3 independent experiments; Student's t test, *p < 0.05.
